As the world’s first and most valuable cryptocurrency, Bitcoin has attracted immense attention for its potential to disrupt the traditional financial landscape. At a time where central banks are desperately churning out freshly printed cash to save the melting banking ecosystem, the value of Bitcoin as an alternative and decentralized store of value is more prominent than ever.
But how well is this decentralization holding up as the network matures?
A common criticism of Bitcoin is that its supply is concentrated in the hands of a select few whales, birthing concerns such as centralization risks and market manipulation.
In this article, we’ll dive into the data to explore the evolving landscape of Bitcoin’s supply distribution and the role long-term holders play in shaping it.
Also Read: The Shocking Truth About Bitcoin’s Limited Supply
A Glassnode Recap
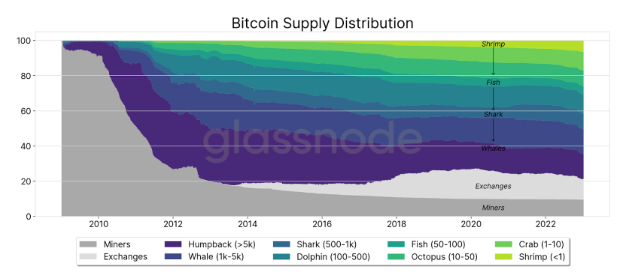
Recently, Glassnode released a comprehensive analysis of Bitcoin’s supply distribution, shedding light on the distribution dynamics across various wallet cohorts.
Recently, Glassnode released a comprehensive analysis of Bitcoin’s supply distribution, shedding light on the distribution dynamics across various wallet cohorts.
The study revealed that Bitcoin’s supply is continually dispersing to smaller wallets, driven by both miner production and market cycles.
Two pivotal events stand out: the March 2020 sell-off and the mid-2022 deleveraging and FTX collapse, both of which significantly influenced wallet cohort behaviors.
Dissecting Glassnode’s Insights: The Data Tells the Tale
The Glassnode report offers several key insights into the dynamics of Bitcoin’s supply distribution. Let’s examine some of the most significant data points and their implications on the network’s decentralization progress.
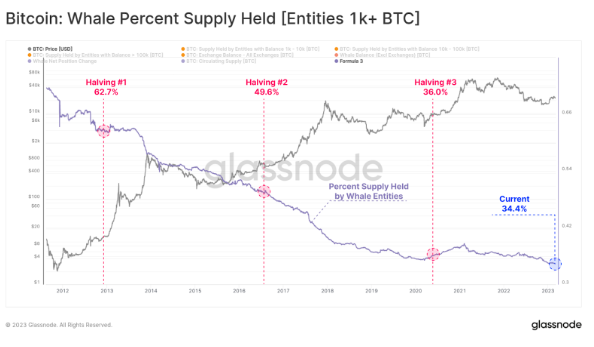
- The largest cohort, Whales (1,000 to 5,000 BTC), once held 62.7% of the circulating supply, but this has consistently declined to 34.% today. This represents a massive 45% dilution over 7 years.
- Conversely, the smallest cohorts, Shrimps (0.001 to 0.01 BTC) and Crabs (0.01 to 0.1 BTC), have grown significantly. In 2016, these cohorts held a mere 5.1% of the total supply. Fast forward to September 2021, and their combined share has surged to 23.4%, illustrating a substantial increase in retail participation.
- This is an increasing phenomenon, with a 105% yearly adoption rate for shrimps and an even higher 119% for Crabs.
- Following the March 2020 sell-off, the Whales cohort experienced its first notable increase since 2016. This change is likely attributed to the entrance of institutional and corporate capital into the market, with entities like MicroStrategy and Tesla purchasing large amounts of Bitcoin.
- The mid-2022 FTX collapse and subsequent deleveraging prompted a decline in the share of the Whales cohort once again. This event coincides with an increase in the Shrimps and Crabs cohorts, as well as a spike in Bitcoin held in self-custodied wallets, moving BTC away from exchanges. This not only represented a brutal reminder of counterparty risk, but also indicated a structural shift towards decentralisation and self-custody.

Overall, the Glassnode report clearly outlines that BTC supply is continuously becoming more and more distributed, with an increasingly large proportion of supply held by smaller entities.
With on-chain visible institutional adoption post March 2020, the BTC ecosystem is looking increasingly healthy.
The Coin Days Destroyed Dance
Coin Days Destroyed (CDD) is a metric that quantifies the age of coins being redistributed, offering insights into the behavior of long-term holders. By incorporating CDD into our analysis, we can assess how the redistribution of older coins aligns with the growing dispersion of Bitcoin’s supply.
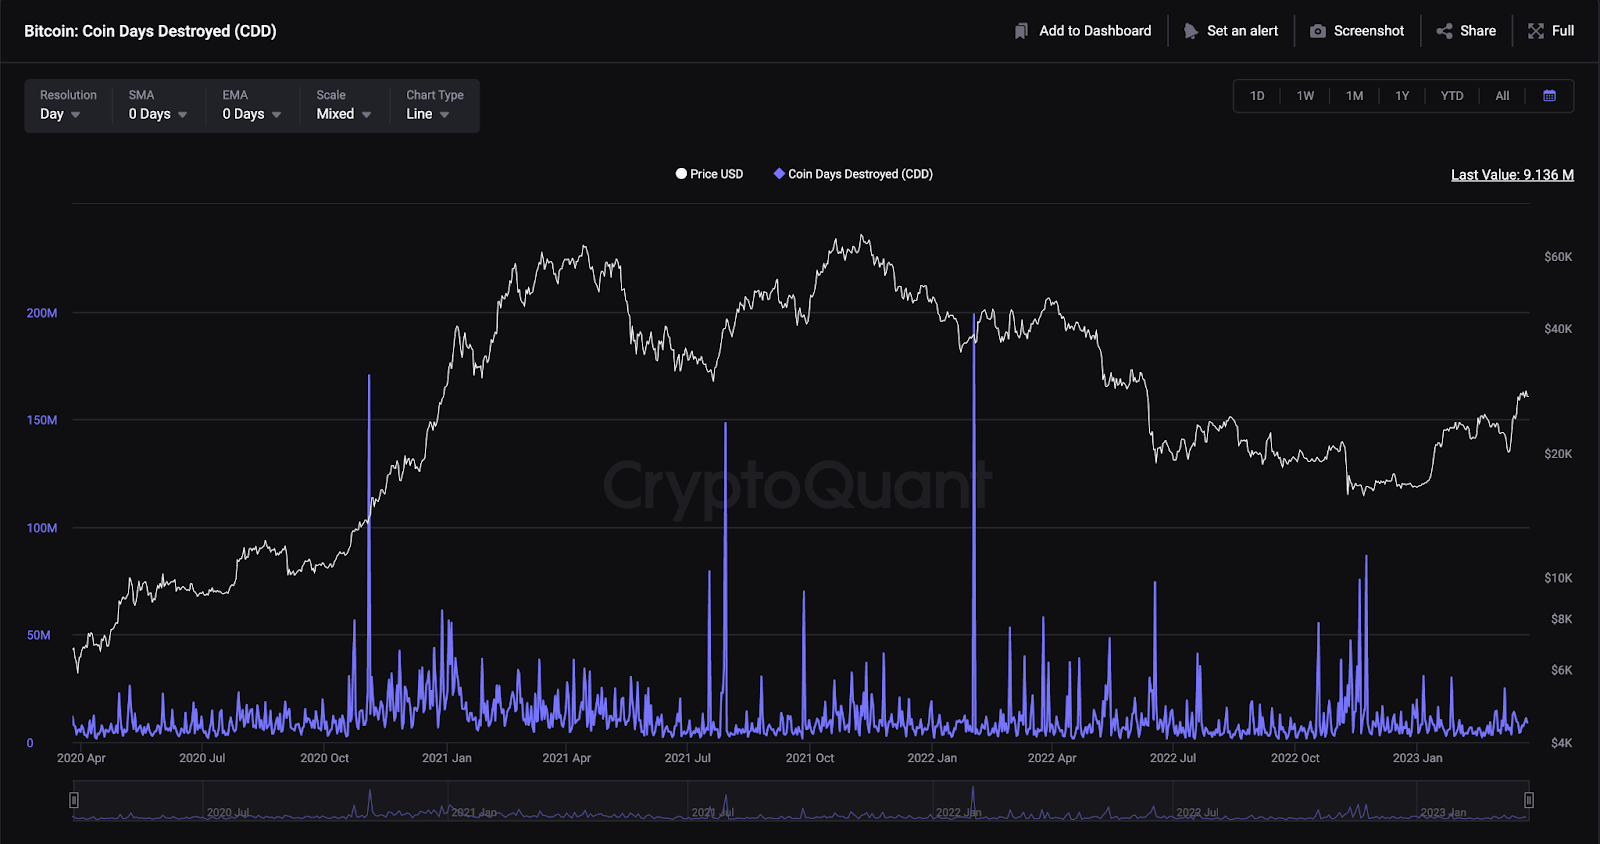
Data reveals that periods of increased CDD coincide with significant supply distribution shifts. For example, during the 2017 bull run, there was a net decline in Whale balances, accompanied by an uptick in CDD.
This suggests that long-term holders were distributing their coins into the market, likely in response to large inflows of new demand and high volatility.
Similarly, the 2020-21 bull run saw the first major expansion of balance held by Whale entities since 2016, alongside an increase in CDD. This period marked the entrance of institutional and corporate capital into the space, as well as the expansion of ETP products like GBTC and other ETFs.
Connecting the Dots: CDD and Decentralization
By analyzing CDD alongside the Glassnode report’s findings, we can draw several conclusions about the relationship between long-term holders and Bitcoin’s decentralization progress.

- Long-term holders have played a critical role in redistributing Bitcoin’s supply. As the data shows, periods of increased CDD align with significant shifts in wallet cohort behaviour and supply distribution. This pattern suggests that the strategic selling of long-held coins contributes to the ongoing dispersion of Bitcoin’s supply across smaller wallet cohorts.
- Market events, like the March 2020 sell-off and the mid-2022 FTX collapse, have accelerated the redistribution process. These events led to a decline in the share of the Whales cohort and an increase in the Shrimps and Crabs cohorts. The confluence of CDD spikes and these market events implies that long-term holders are capitalising on periods of heightened market interest to further disperse the supply.
- The growing trend towards self-custody is another indicator of Bitcoin’s progress towards decentralisation. As more users opt for self-custodied wallets, the supply becomes less concentrated within a few centralised exchanges and custodians. This shift not only promotes decentralisation but also empowers individual users to take control of their assets, reinforcing the core principles of the Bitcoin network.
Diving deeper into the Coin Days Destroyed (CDD) statistics and examining participant types, we can derive two key insights that shed light on market fluctuations and behavioural trends within the crypto ecosystem:
- Shrimps and crabs: These groups have relatively low CDD values, indicating shorter holding periods. They exhibit more volatility in their CDD values, suggesting higher responsiveness to price movements and market conditions. This results in a buy-high, sell-low behaviour, particularly evident during bull and bear markets.
- Whales and humpbacks: These influential investors showcase higher CDD values, signifying longer holding periods. They exhibit more stability in their CDD values, implying less susceptibility to price fluctuations and market noise. Their actions reveal a buy-low, sell-high strategy, as they destroy fewer coin days during bull markets and more during bear markets.
Final Thoughts
The data-driven analysis of Bitcoin’s supply distribution and the Coin Days Destroyed metric paints an optimistic picture for the network’s decentralization progress.
Long-term holders play a pivotal role in redistributing the supply, and market events have served as catalysts for these shifts.
As the network continues to mature and more users embrace self-custody, Bitcoin’s decentralisation is likely to strengthen, fostering a more resilient and robust financial ecosystem.
The dance of decentralization continues, and as the beat goes on, Bitcoin’s potential to reshape the financial world only grows stronger.
Also Read: Bitcoin Hits Yearly High of US$30,399 – Here’s Why The Crypto Markets are Up This Week
[Editor’s Note: This article does not represent financial advice. Please do your own research before investing.]
Featured Image Credit: Chain Debrief
This article was written by Harry Vellios and edited by Yusoff Kim