Are you knee deep into crypto? Constantly checking prices, TVL, wallets and other cryptocurrency metrics?
Then you must have heard of Nansen, or have even signed up for their platform. If you haven’t, fear not!
For the uninitiated, Nansen is a Singapore-based blockchain analytics platform that combines on-chain data with a massive database containing millions of wallet labels.
They have recently released a free version of their tool as well.
Let us walk through the features that are available in this version, and how you can make use of them in your own crypto research.
Home overview dashboard
This home dashboard provides a good broad overview of some key indicators:
This includes the hottest DeFi contracts, tokens and NFT projects based on their activity in the past 24 hours.
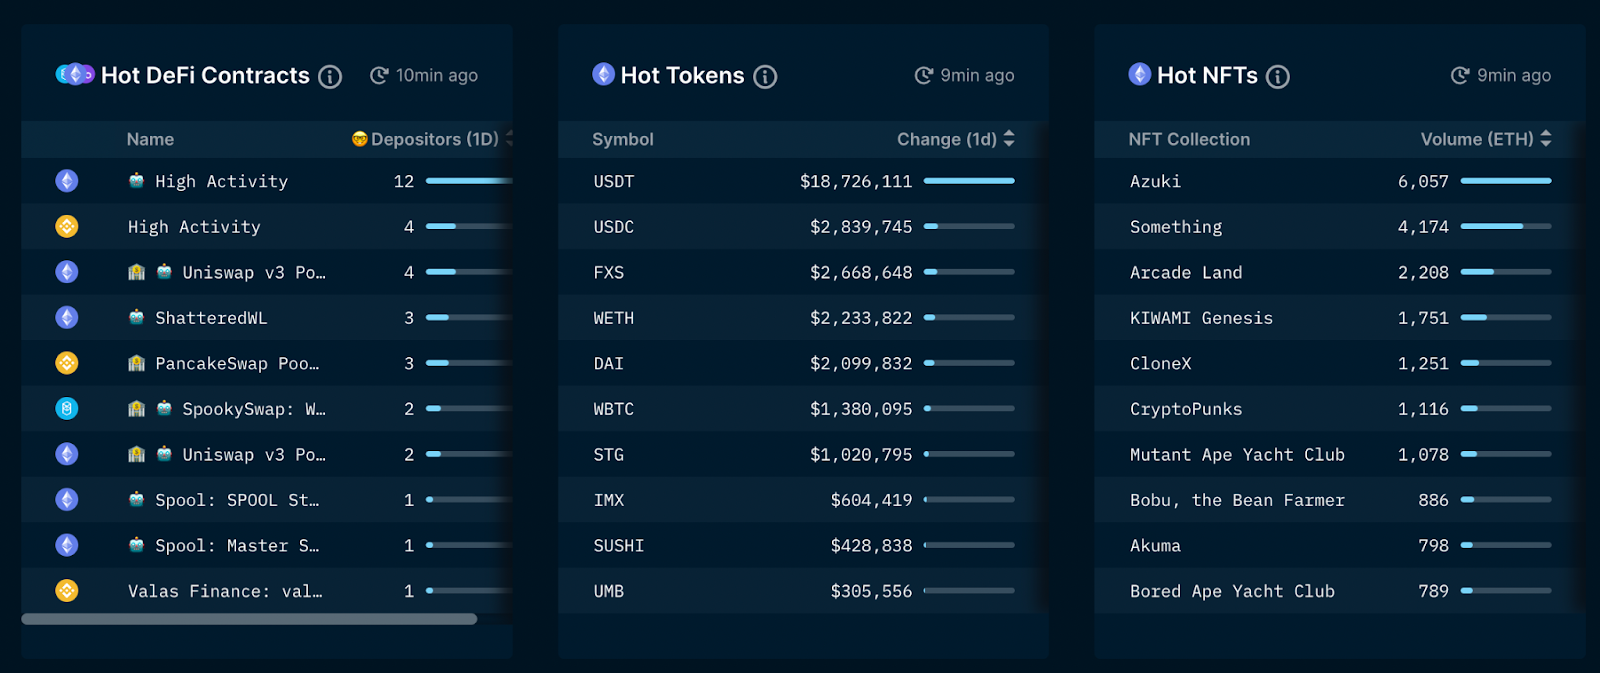
Hot DeFi contracts
First, this feature shows you the DeFi contracts with the top number of smart money depositors across different chains.
Smart money refers to wallets that are very active and prolific. This would include wallets that are considered a fund, smart Liquidity Provider, or whale wallets.
This would give you an idea of the top DeFi protocols that you can take note of in recent days.
Hot tokens
This feature shows you top changes in token volume within a 24 hour period, by the aggregated smart money segment.
A huge positive inflow will indicate that smart money is actively purchasing the specific token.
Similarly, this gives you a quick idea of the top tokens that smart money is accumulating.
Hot NFTs
The Hot NFTs tab shows NFTs with the most activity (in ETH volume) in the past 24 hours.
Note that this refers to NFTs that are bought and sold at the highest volume, and not necessarily the top NFTs in floor price/value.
GM Digest — Market News
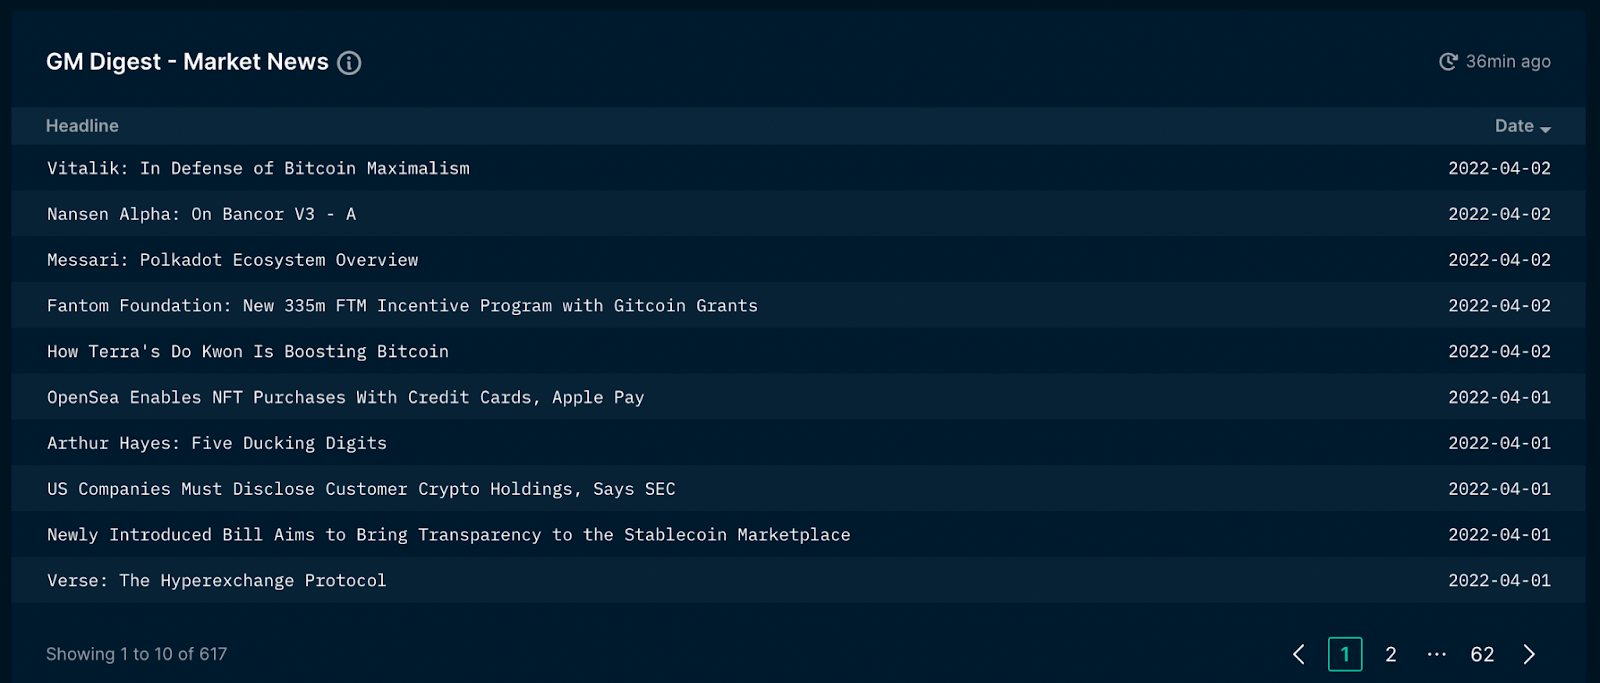
This tab shares daily news articles and information from trusted sources, curated by Nansen.
This can be a good source of alpha for both crypto native projects, and Web2 projects that are getting involved in Web3.
Instead of scouring through Twitter and hundreds of other tabs you have open, this shares them all in one place.
NFT Paradise
NFT enthusiasts, keep your eyes peeled for this section!
Market Overview
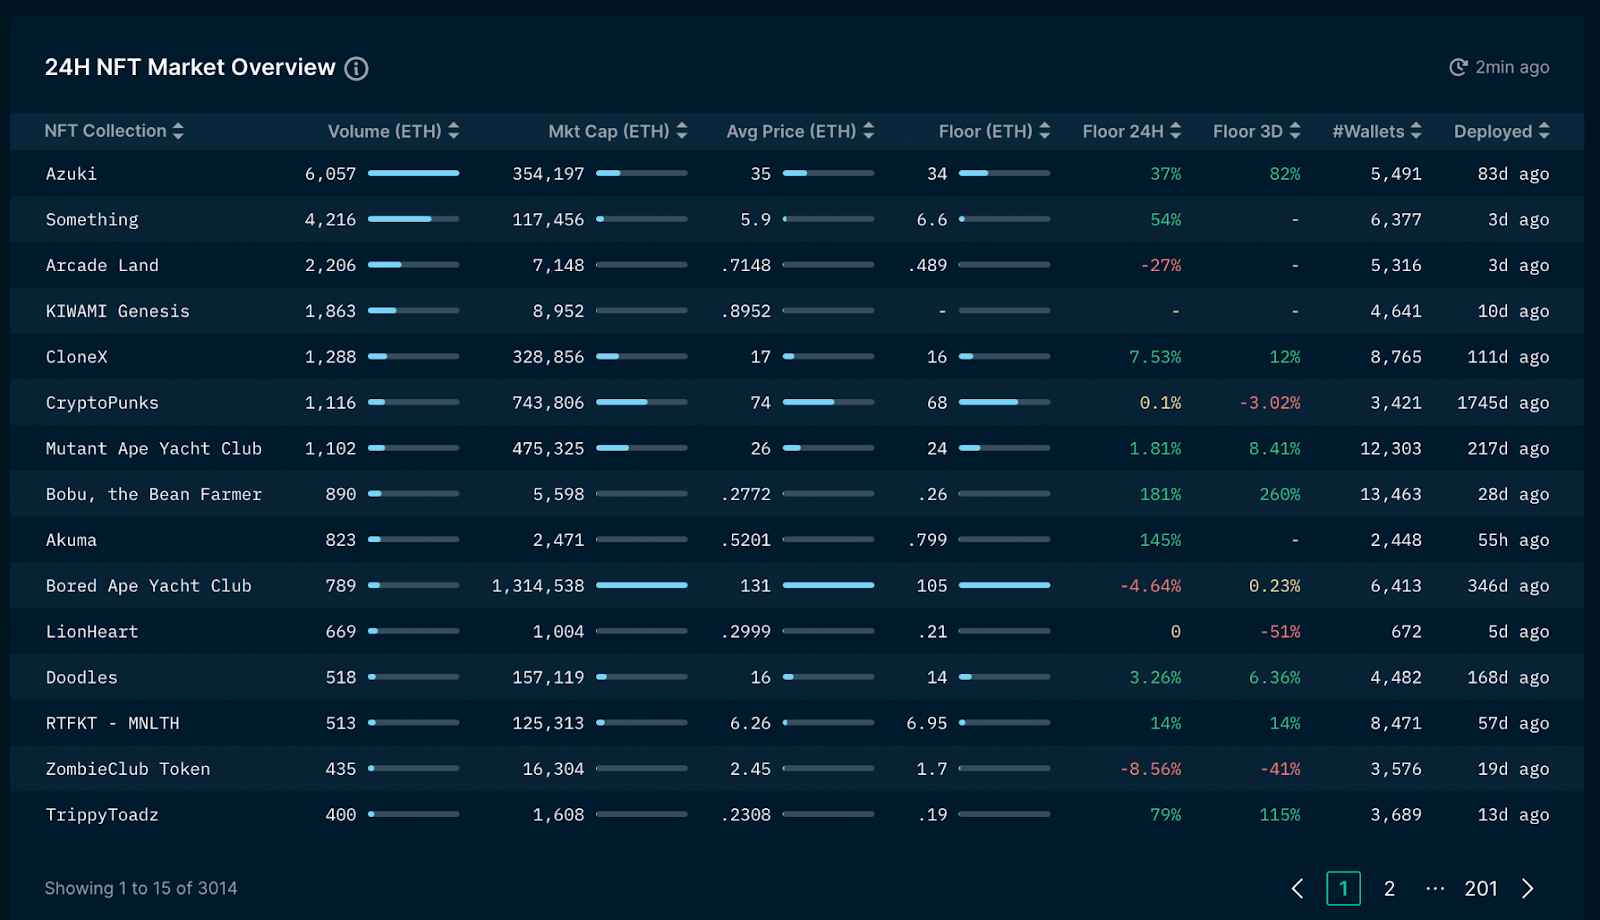
In this feature, you can easily see a 24-hour overview of the top performing NFT collections. One feature I find very useful is a bird’s eye view of the top collections’ floor prices.
Beyond just finding out their floor prices, you can also observe the changes in floor prices.
Simply toggle the “Floor 24H” to view the collections that had the biggest rise in floor prices over the past 24 hours.
Another key aspect of NFT collections are their sales volumes, which you can also have an easy view over at the Volume (ETH) column.
Trends
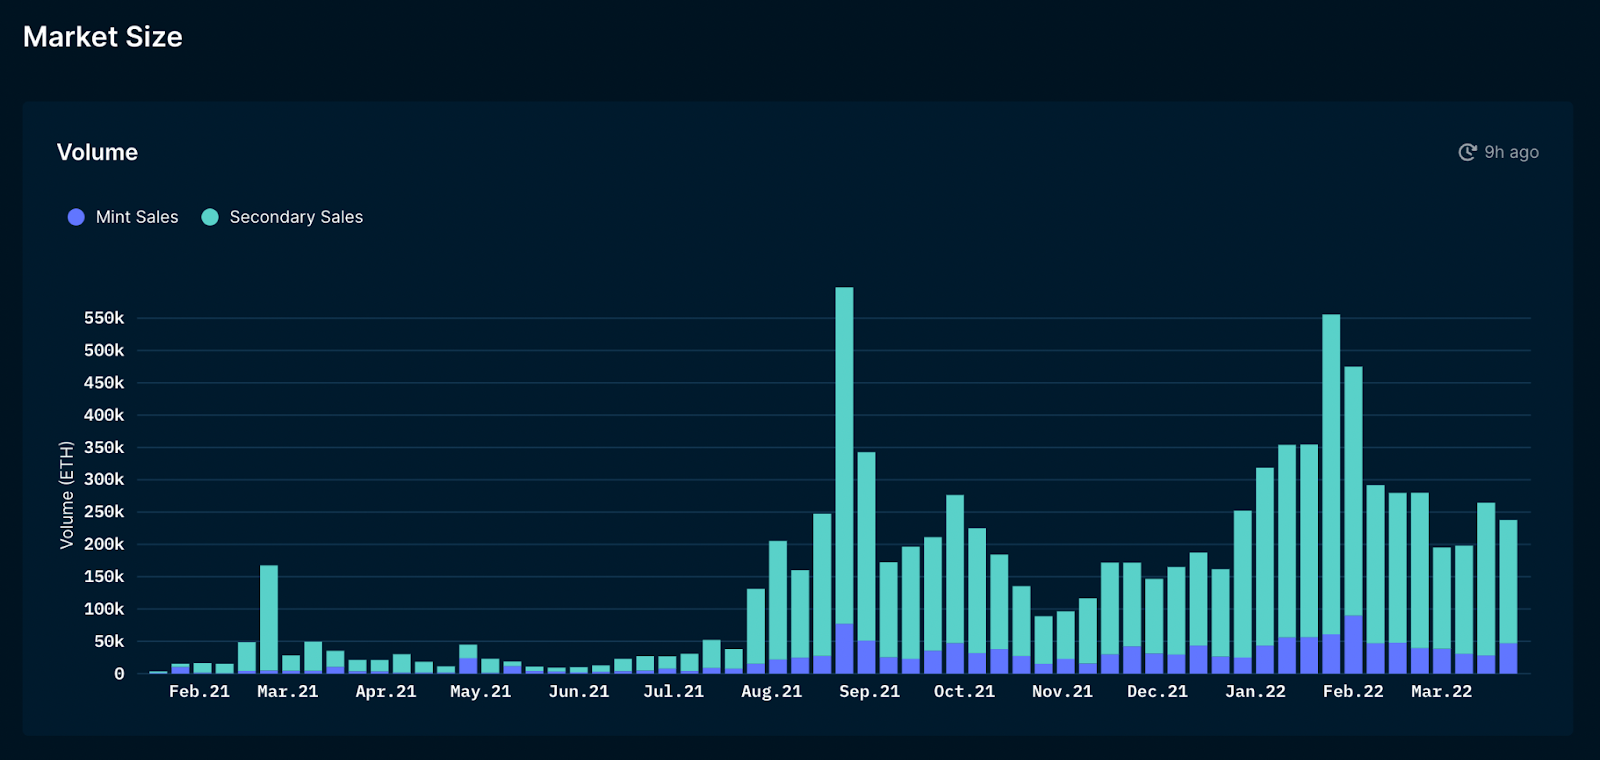
In the trends section of NFT Paradise, you can also find charts and numbers that give you a good broad overview of the NFT landscape in general.
For example, you can check the 30-day sales volume and its change from the previous 30 days, to have a sense of the overall activity of the NFT market.
There are also other useful indicators that you can check, such as weekly transactions, users and wallet activity.
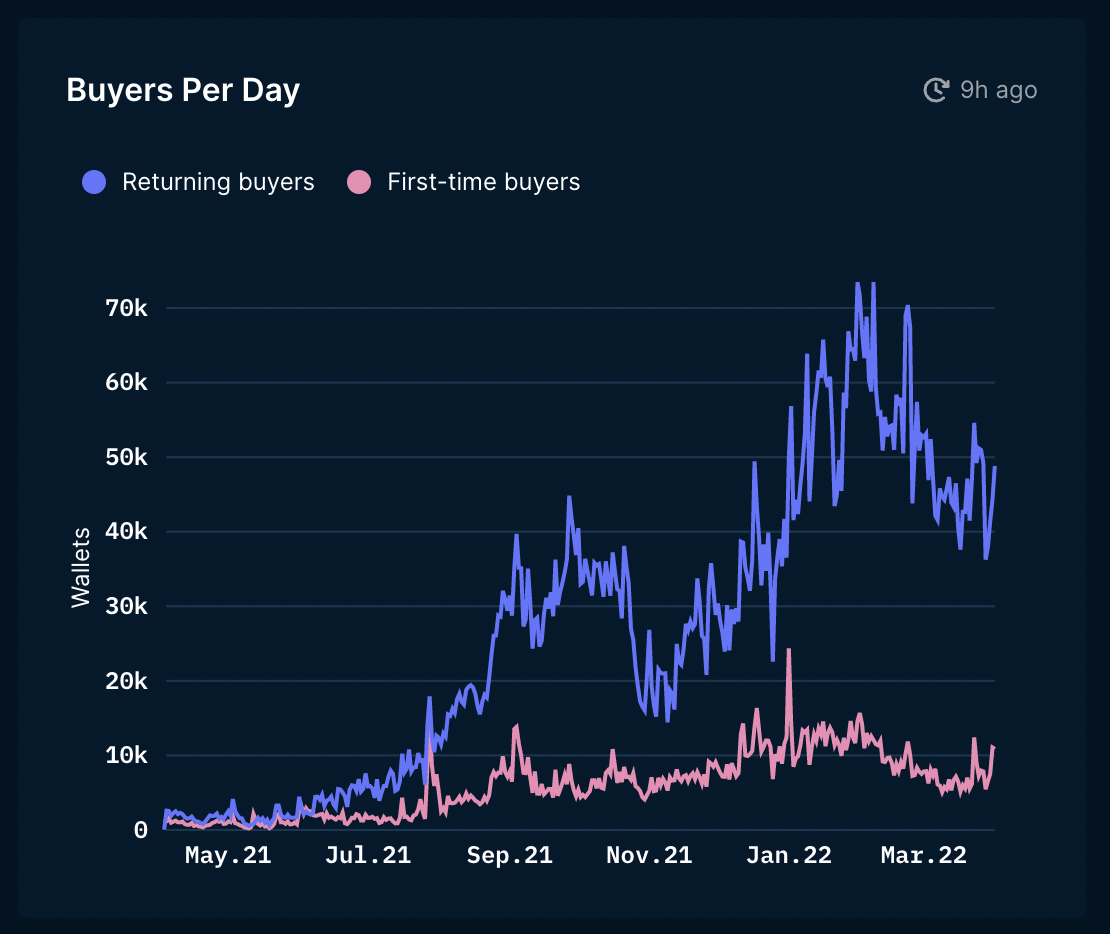
Another interesting one is the buyers per day chart, split between new and returning buyers.
This helps you find out if there are new entrants to the NFT market, or if changes in volume are mainly due to existing users’ activity.
NFT Indexes
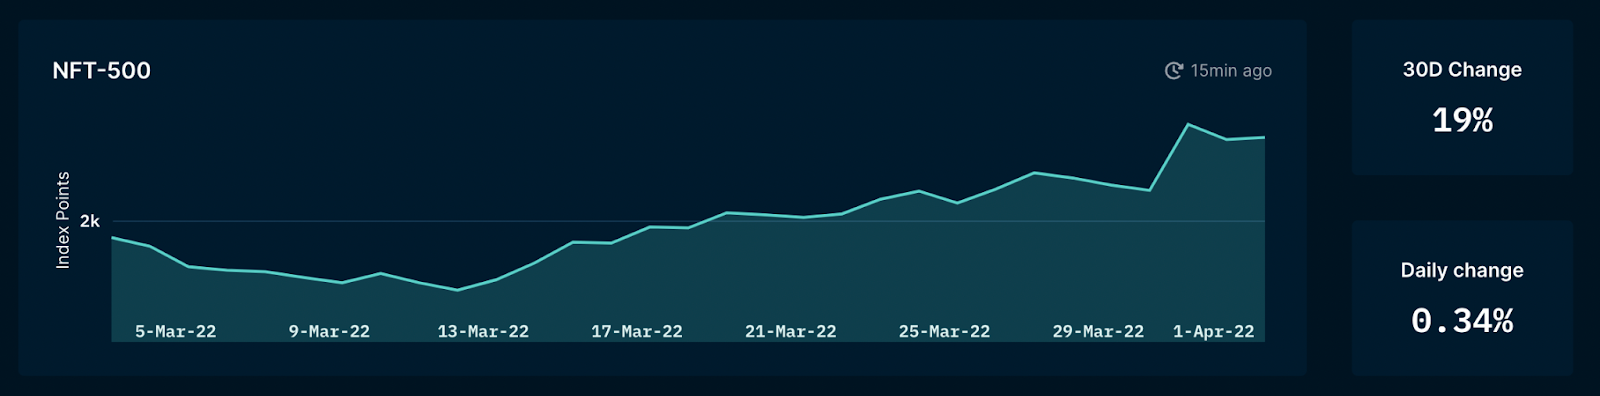
Another feature that is interesting is the NFT indexes.
Here, you will be able to see the different changes in index points, across the different types of indexes.
But what do they mean, exactly?
The NFT-500 is a broad market index tracking the market activity of NFTs issued on the Ethereum blockchain. It consists of 500 NFT collections, weighted by market capitalisation.
The Blue Chip-10 index It consists of ten top-tier and well-established NFT collections organised by its market capitalization.
The other NFT collections similarly track the top NFTs in their own sectors, ranked by market capitalisation.
You can use these indexes to have a sense of how specific NFT sectors that you are interested in are performing over time.
Conclusion
The NFT space moves rapidly, and it can be tough to keep track with all these constant changes.
Tools like Nansen give us an easy way to track various trends and statistics to look out for.
The free tool that Nansen provides gives us a glimpse of what’s possible with crypto analytics.
Hope these features will be helpful in your analysis and investing decisions!
Featured Image Credit: Martech Series
Also Read: Your First Step Into The Crypto World: Top 10 Free Crypto Tools
Was this article helpful for you? We also post bite-sized content related to crypto — from tips and tricks, to price updates, news and opinions on Instagram, and you can follow us here!