The next edition of the technical analysis series is the McClellan Oscillator. This tool is effective in finding the price momentum of an asset. Created by Sherman and Marian McClellan, the basic formula is derived from the 39-day exponential MA out of the 19-day exponential MA of Net Advances.
It resembles a similar mechanism to MACD where divergences and centre line crossovers are involved and applicable to any time frame to trade crypto.
What is the McClellan Oscillator?
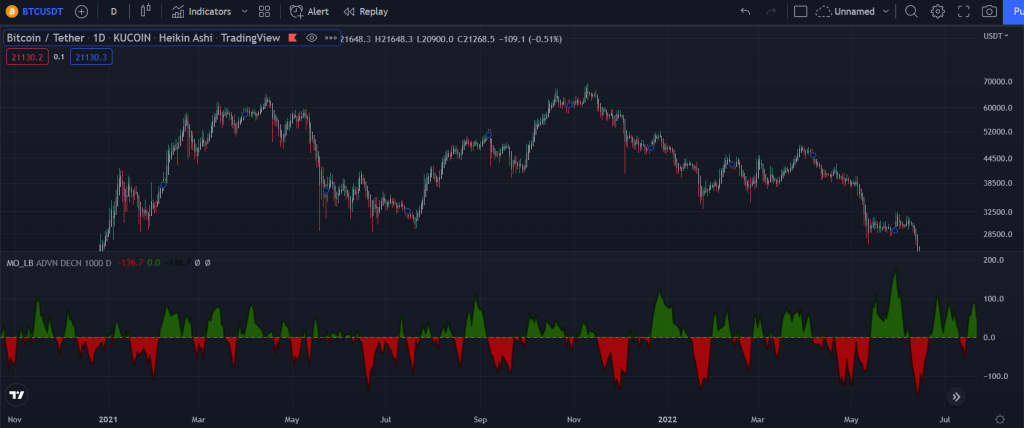
In summary, it is a market breadth indicator based on the subtraction of advanced and declined numbers.
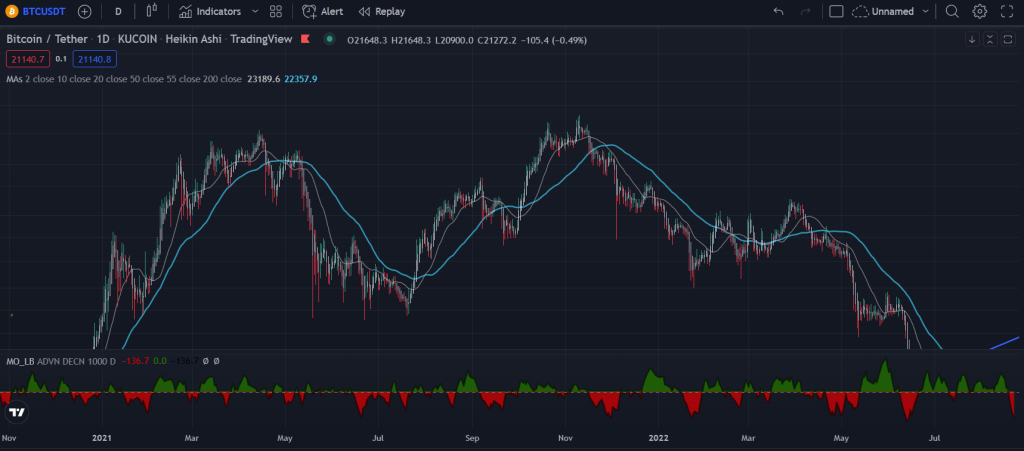
Where the oscillator moves upwards or rises above the neutral point, shows strength in the market while when it moves below, the overall market goes down.
When green above the neutral line, the market sentiment is buy/long. When red below the neutral line, traders should focus on sell/short trades.
How to trade it?
Being a breadth-based indicator, it may help you find where the prices of the asset are heading towards. Honing this tool with other technical analysis tools for assessing strength may prove to formulate a strong indicator in price direction.
There are many ways you can trade using this tool, you first have to identify that before venturing into your trading journey. Think about the time frame you are planning to trade, would it be for the short term or the long one?
Short term strategy
When approaching a short-term strategy, you would want to look at breakouts, which you can use the 20 EMA indicator and the oscillator to identify. FXTechlabs mentioned this short-term strategy works particularly strong in the 5 and 15-minute time frames.
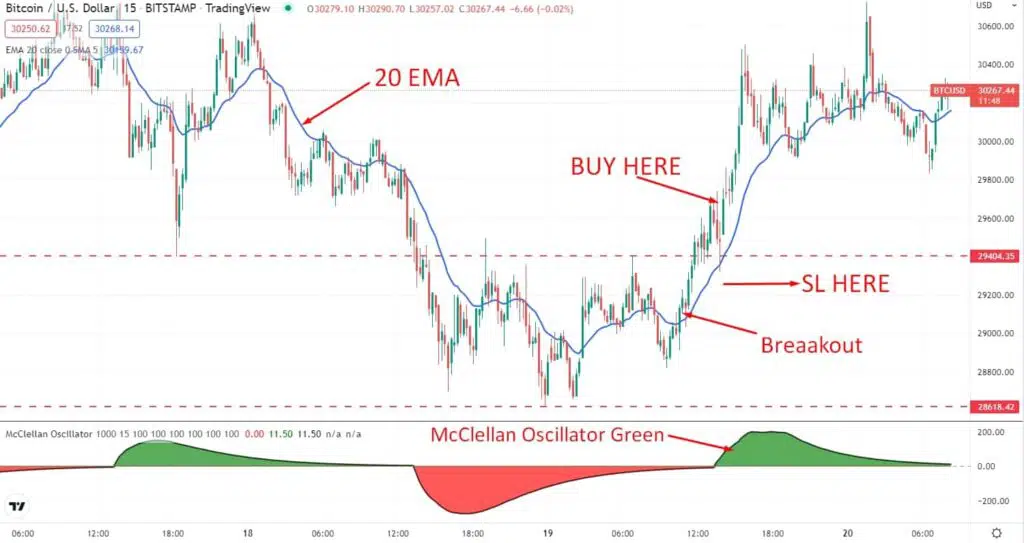
In a bullish trend, first look at the oscillator, especially when the indicator is green and the price breaks above the level of 20 MA.
Set your stop loss below the dynamic level of the 20 MA with at least a 5-10 pips buffer, or a 5% relative to your position.
When taking profit, it is best to look at a 1:3, risk: reward ratio.
You would do almost the opposite in a bearish trend. First, look for the price breaking downwards of the 20 MA, and the oscillator indicator is red.
This way you can ride your short position all the way when the green candle breaks above the 20 MA line or when it retests the 20 MA line.
You would want to respect the golden ratio of 1:3 again and set your stop-loss for a short position above the 20 MA line.
Long term strategy
The long-term strategy is similar but slightly different. Here, we look at 2 moving averages, the 21 and 50-day MA. This may be suitable for traders trading at the 4-hour and daily time frame.
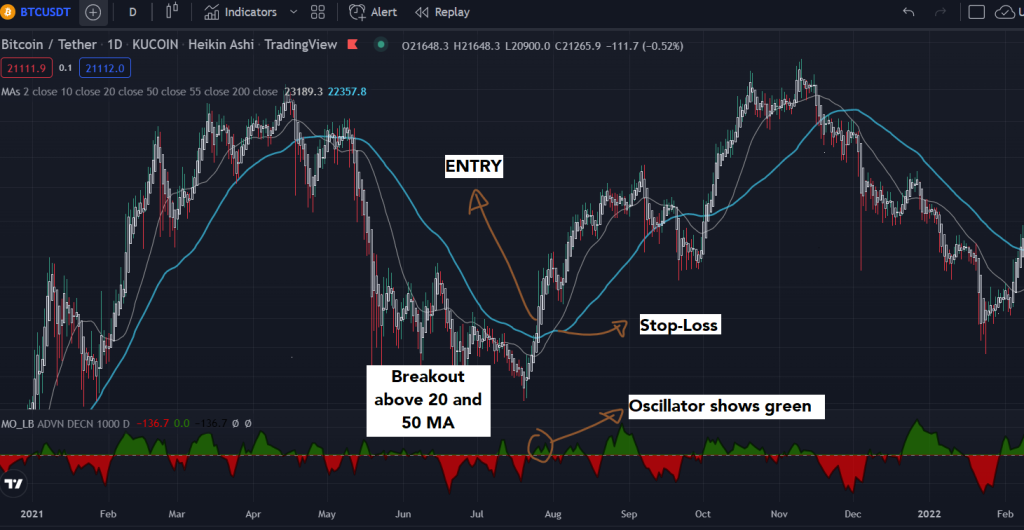
Remember the conditions for a long trade, the Oscillator showing green and the breakout across the 20 and 50 MA.
In a bearish trade scenario, you would want to look at the opposing factors. Can you identify them?
Closing thoughts
The Oscillator helps assess the advance and decline line in momentum and easily shows the market momentum in achieving the best trades. Because the premise of this tool is based on MA data from the past, it is best used in a longer-term time horizon trade.
However, signals may be false and it does not guarantee a 100% success rate, especially with the volatile market of crypto, the oscillator may bounce back and forth in the green and red zone.
It is best not to use this tool alone, pair it with other indicators like volume and support and resistance levels for a clear picture of identifying trends.
[Editor’s Note: This article does not represent financial advice. Please do your own research before investing.]
Featured Image Credit: ChainDebrief