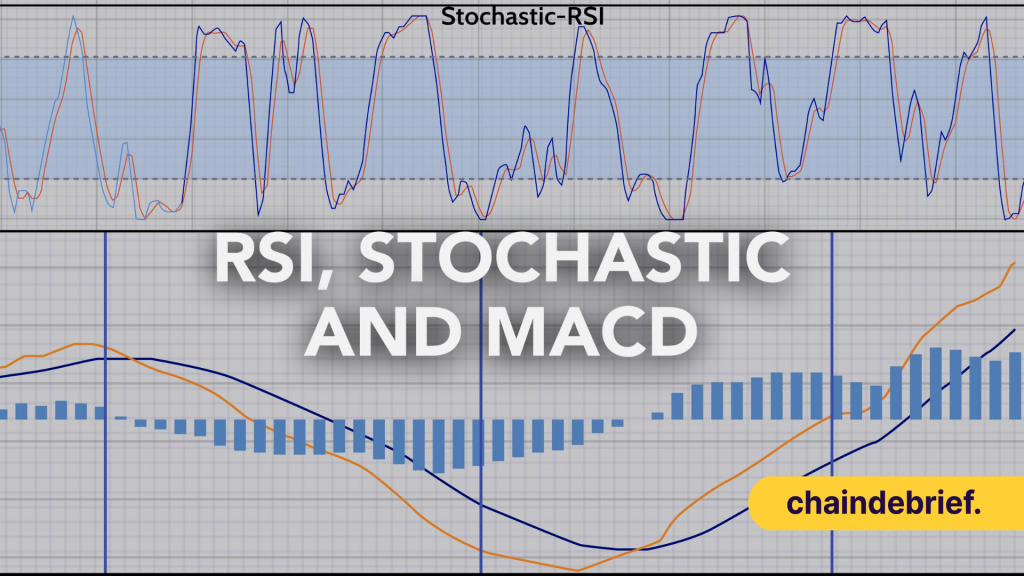
These tools are a combination of the RSI, Stochastic oscillator and the regular MACD (Moving Average Convergence/Divergence). Stochastic compares the asset’s closing price to its price over a certain period of time while MACD shows two moving averages diverging and converging with one another. RSI, is the main momentum indicator traders would use in measuring the recent price changes.
Name me a better trio.
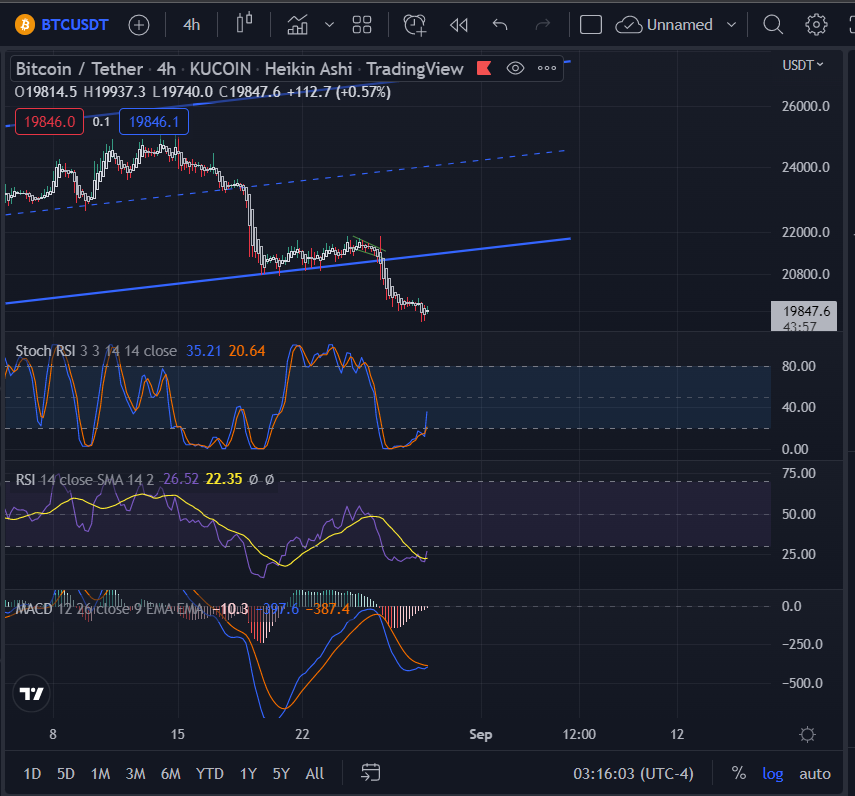
Stochastic, identifying overbought/oversold levels
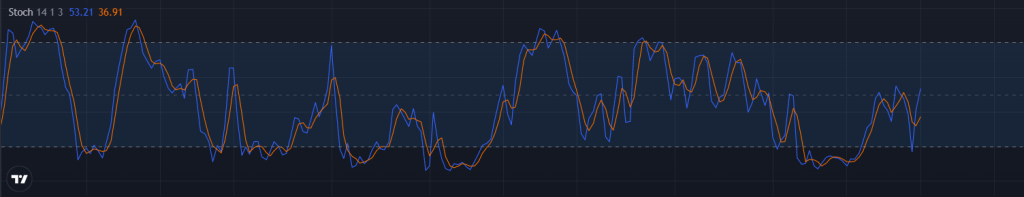
There are two lines you should be aware of in the Stochastic tool. The K-Line (blue) represents the closing price while the D-Line (orange) is the moving average of the K-Line.
The stochastic should be your main entry signal. The ranges the lines are bound in are important metrics to see if the asset is oversold or overbought.
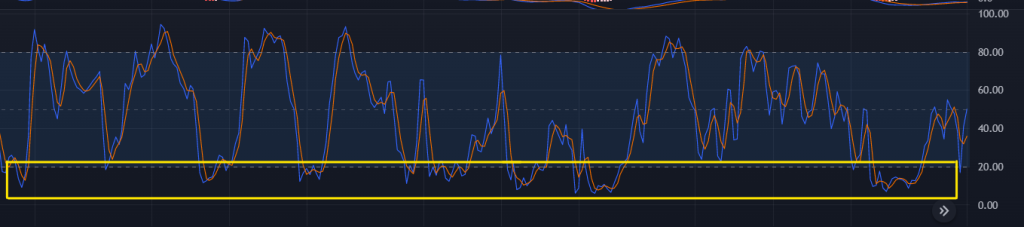
When the K-Line (blue) drops below 20, labelled in yellow above, it indicates a buying/long signal as the asset is oversold.
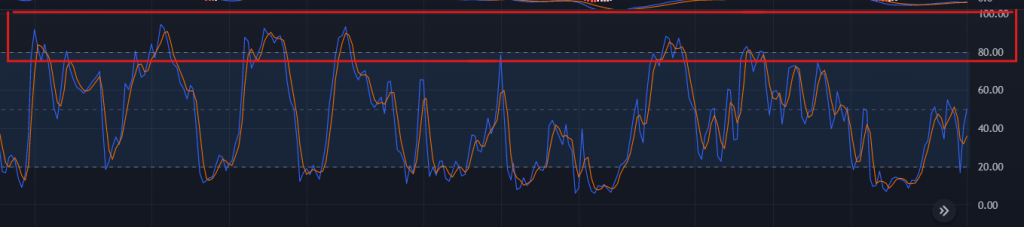
The stochastic can be used alone if you just buy in oversold regions and sell in overbought regions but brings you a low success rate.
RSI, trend confirmaton
One of the most popular tools used in trading, a popular way of using the RSI trading in the overbought and oversold regions. But we already have the stochastic for that.
So in this combination of tools, we use the RSI for trend confirmation.
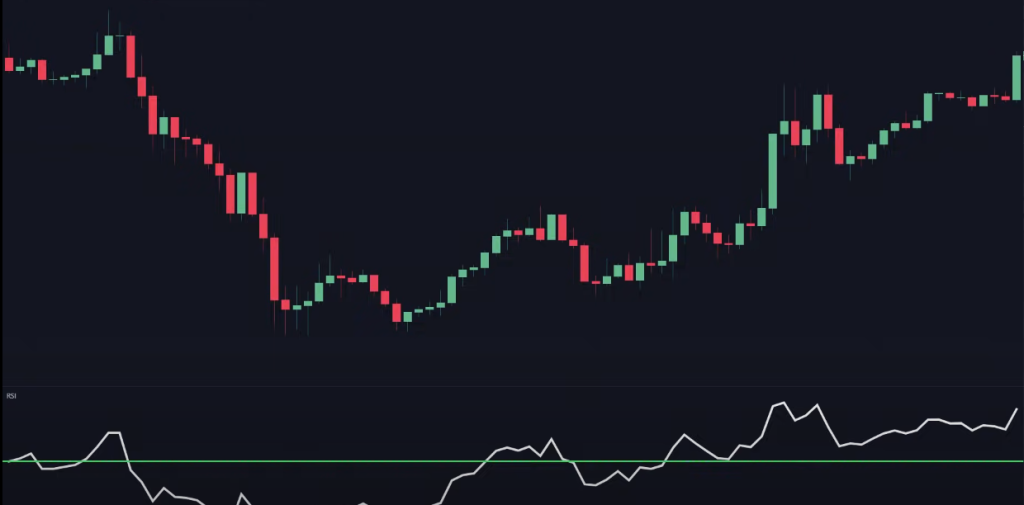
What I did was change the settings within RSI into one single line, on the 50.
Anything above the green line, would be a buy signal because it is an upward trend.
On the other hand, anything below the middle line shows the price on a downtrend, so you would take a sell position.
Remember, there are many ways to employ the RSI indicator, for this demostration we are using it as a trend confirmation.
MACD, detecting momentum
MACD (Moving average convergence divergence) indicates price trends and market directions, a momentum indicator.
It is formulated by subtracting the 26-day moving indicator from the 12-day moving indicator in its price.
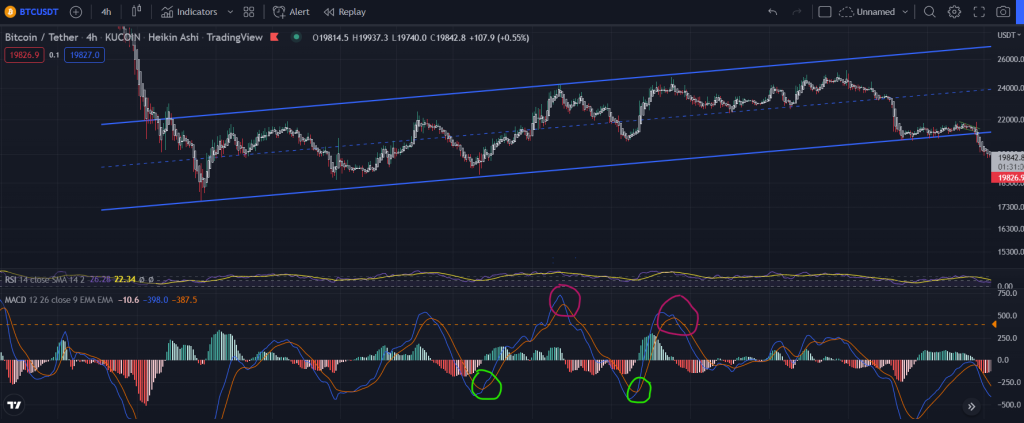
The common strategy to use with the MACD is through crossovers. Circled in green, you would want to take a buy signal when the MACD line (blue) crossess over the signal line(orange). On the flipside, take a sell position when the MACD line (blue) crossess below the signal line(orange).
However, this only works in trending markets. When the market is moving sideways, the MACD often gives false signals.
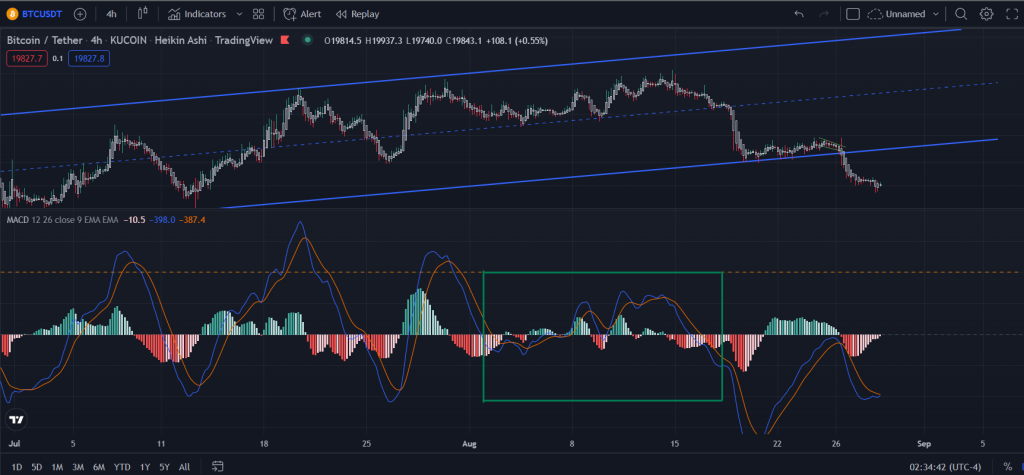
For this set of combination tools, we are not looking at the MACD crossovers. Instead, it is a 3rd layer of confirmation to ensure the mometum of the market is on our side.
Entry for a buy signal
Step 1: Look at stochastic, then make sure both K and D lines are in oversold regions.
Step 2: Use RSI to confirm the upward trend by making sure it is above the middle line (50).
Step 3: Use the MACD to confirm the upward movement. You have to make sure the MACD line crosses above the signal line.
Step 4: Ensure that both of the stochastic lines has not hit overbought levels yet.
Step 5: Take a buy/long position.
Entry for a sell position
Step 1: First look at stochastic, then make sure both K and D lines are in overbought regions.
Step 2: Use RSI to confirm the downward trend by making sure it is below the middle line (50).
Step 3: Use the MACD to confirm the downward movement. You have to make sure the MACD line crosses below the signal line.
Step 4: Ensure that both of the stochastic lines has not hit oversold levels yet.
Step 5: Take a sell/short position once all rules are met.
Exit strategy
You would want to place your stop loss at the nearest swings lows while if you took a short positon.
If you are in a long position, you would want to place your stop loss above the nearest swing high.
However, trading always varies from individuals. This could be based on the individual’s risk tolerance and appitite. Targetitng a stop loss at the nearest swings may still accumulate large n might also want to minimize your risk by having a tighter stop-loss percentage.
Considerations
Not all strategies are proven and 100%. There is always a possibility for indicators to go south from their intented results even when all points on the checklist are being checked. Bigger forces are always in play.
Find other real time indicators to pair these set of tools for a better confirmation in trends, price movements and momentum like the volume and
[Editor’s Note: This article does not represent financial advice. Please do your own research before investing.]
Featured Image Credit: ChainDebrief
Also read: Want To Short BAYC? nftperp Lets You Do Just That With 5x Leverage