To buy or not to buy? That is the question. The short answer to that is nobody knows. I buy the dip, and the dip dips even more; when I choose to wait for the dip to dip, the market pumps. No lunch is ever free, but today we look into on-chain indicators which may, but not guarantee, help you spot crypto market bottoms.

While timing the bottom is a straightforward and simple concept, most of us WILL not get it right. Instead, experts suggest a lazy but effective approach to making money: dollar cost averaging. But the DCA approach takes time, and timing the bottom seems faster. You probably clicked on this article for that very reason.
1. On-Balance Volume (OBV)
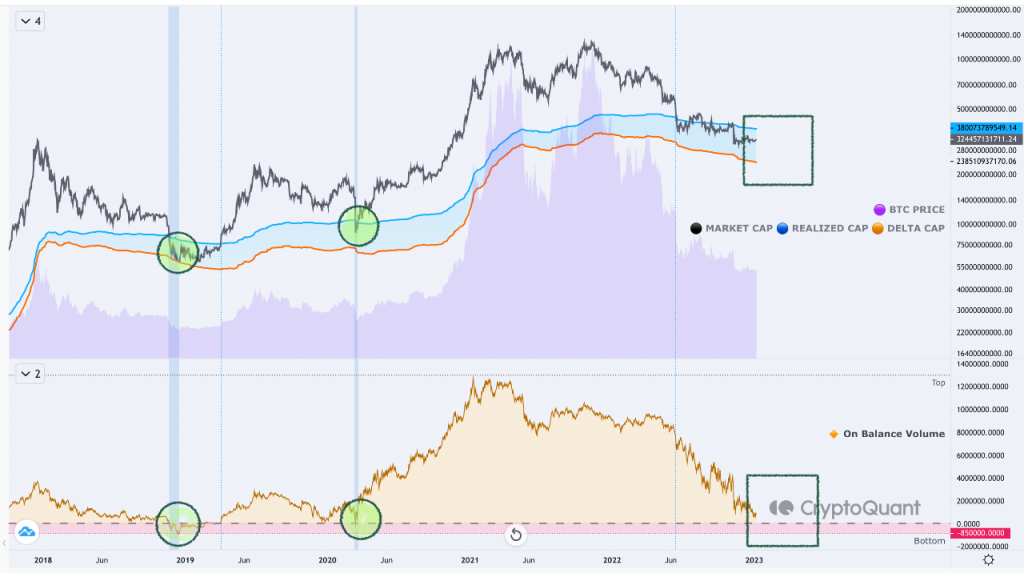
The first indicator which may help you identify a possible market bottom is referencing the price with on-balance volume. OBV measures buying and selling pressure as a cumulative indicator that adds volume on up days and subtracts volume on down days.
This bangs on the fact that the volume will correlate with the price movement. If the price of an asset goes down, so will the volume similarly, and vice versa.
Judging from past cycles, the market bottomed out when the market cap fell below the realized cap, and the OBV indicator reflected values close to zero. Reversals and market recovery began when the market cap touched the delta cap and OBV index dropping below zero.
2. MVRV Ratio
We have gone through the MVRV ratio on our technical thursdays segment on IG, head over for a refresher.
MVRV, known as market value to realized value, refers to the asset’s fair value. It is often used to identify market tops and bottoms, reflecting periods of extreme investor unrealized profit/loss.
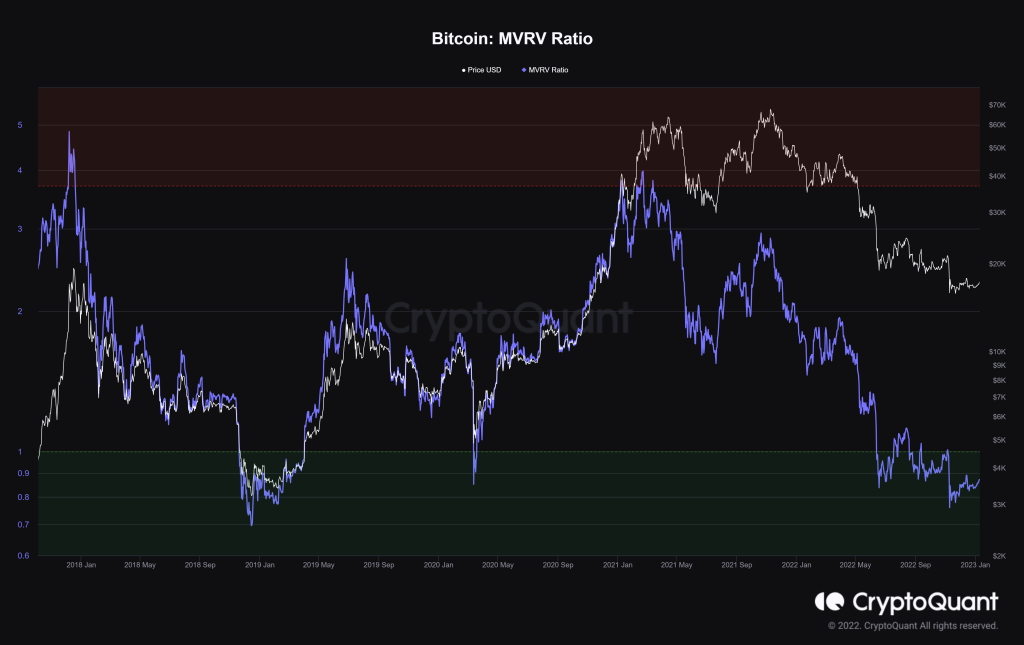
The BTC MVRV charts have fallen to their lowest levels in three years. Currently, we are hovering around the range at the bottom. Historically, values over ‘3.7’ indicated the price top and values below ‘1’ indicated the price bottom.
3. All Exchange Inflow (mean)
Exchange flow is the number of coins deposited into the exchange wallets, and exchange outflow is the number of coins withdrawn from exchange wallets.
A high value indicates investors are sending a greater number of coins in a transaction. It will also likely lead to higher selling pressure which could lead to a future price drop.
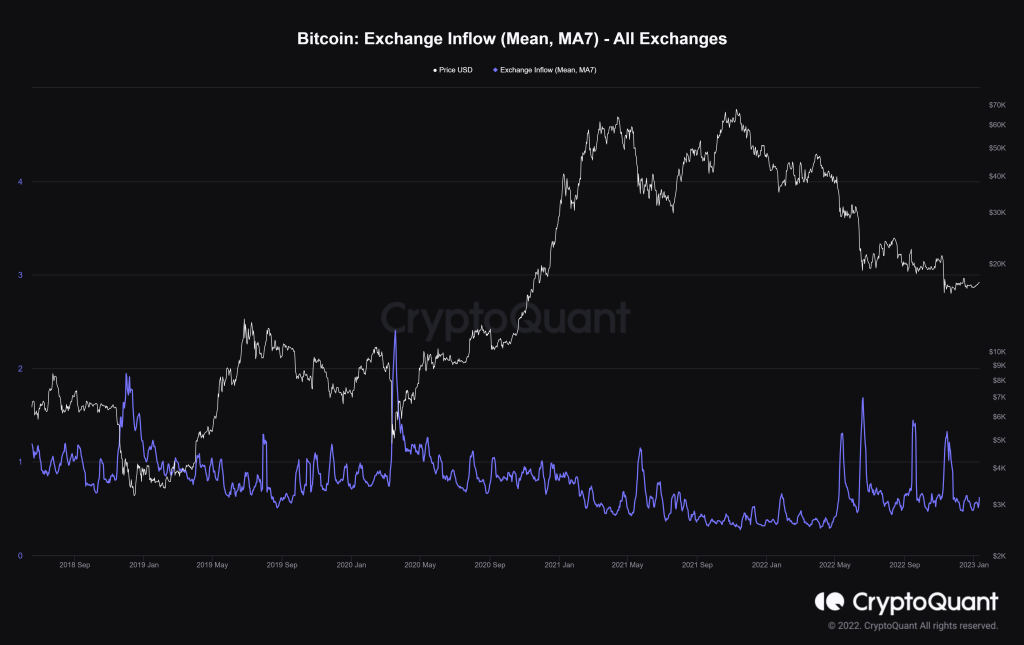
Here is a glimpse of how you are able to buy BTC at global bottoms. Historically, when BTC sees over a 30% plummet or more, the all-exchange inflow (MA7) will likely have a sudden spike to the exchange inflow range of close to 2 and/or higher. You take your entry positions after the indicator cools down, historically a signal for market bottoms.
From the chart above, if you were to follow this strategy, you would have ridden the massive wave in price surge twice. 2022 showed quite an anomaly, with the all-exchange inflow spiking and cooling off on four consecutive occasions, it does not seem we have reached the bottom yet, but a great range to accumulate.
4. Stock to flow
Crypto has its very own stock-to-flow model too.
In the 2018 cycle, Bitcoin’s downtrend finally stopped after breaking out of the previous Stock-to-flow price cycle.
The stock-to-flow model measures the new supply relative to the existing supply. As the name suggests, Stock refers to the total existing supply, while the flow is the new supply of an asset created yearly.
While this measures and compares the relative abundance of scarcity, could it signal us to head out of these choppy waters? Maybe, maybe not.
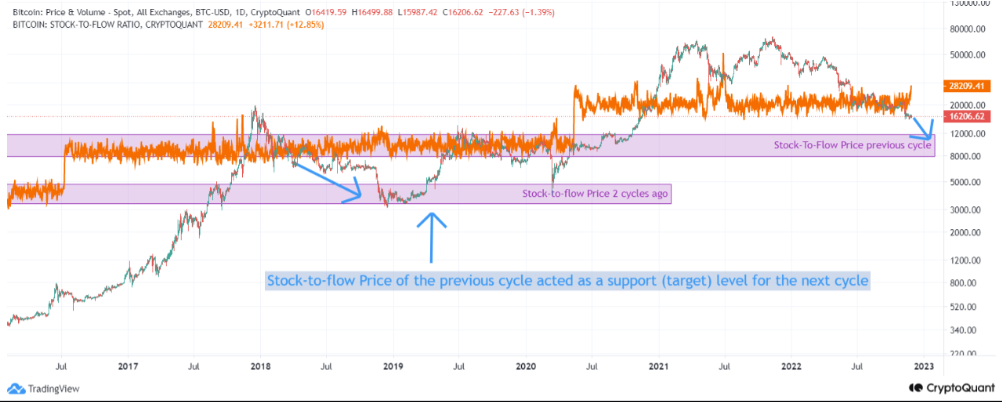
If the aforementioned is going to be true, we have yet to see the worst of the markets; a larger storm is incoming. This very storm will take BTC to $8-11K levels which will not only spells disaster but spiral crypto markets into complete fear.
5. BTC BVOL, Historical Volatility
BVOL is the measure of Bitcoin’s historical volatility. The higher the BVOL score, the more volatile and riskier BTC as an asset is. The market trading sideways would likely lead to a lower BVOL score.
A low BVOL score is usually followed by an explosive move in price in either direction. Since 2018, Bitcoin has only been reduced to low levels of volatility only four times. Currently, we are in one of those times.
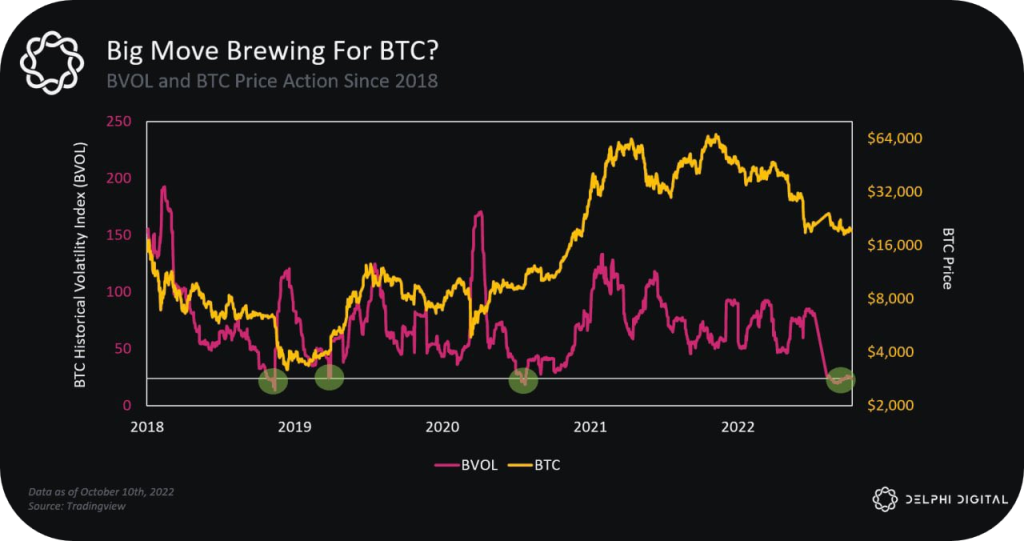
Could we see another leg upwards? Or do we continue to search for the bottom?
Closing thoughts
Honorable mentions, SOPR ratio.
These indicators are not set in stone and are not 100% guaranteed success. Although they give you an idea of where the current market is referencing historical bottoms, timing the bottom is still difficult.
Instead, with the identified “bottoming” range we are currently at, it gives you a perfect time to accumulate a dollar cost average and ride any waves when the market is ready.
I think 2023 will be the year of a cool down, and we only see a significant upside in the tail end of it.
Also Read: The Rise And Fall Of Crypto Lending: What Went Wrong
[Editor’s Note: This article does not represent financial advice. Please do your research before investing.]
Featured Image Credit: ChainDebrief