You’ve probably heard that the market is poised for more downside – but nothing goes down (or up) in one straight line.
Your favorite influencers are most likely going to be wrong. We will not see Bitcoin trading at USD $16,000 anytime soon in my opinion. In fact, I see Bitcoin going to the high 20s and maybe even touching 30 before another slump.
Where do I see the real bottom in Bitcoin? Check out my other article here.
Also Read: Is Anyone Really Winning The Layer 2 War? Here’s What The Stats Say
Fundamental Analysis
Fundamental analysis consists of many layers.
While I would love to delve into the nitty gritty, that should be saved for another study. Here, I will instead go through a simple economic analysis and how Bitcoin and the overall markets will react to it.
Personal Income
Personal income is the income that persons receive in return for their provision of labor, land, and capital used in current production and the net current transfer payments that they receive from business and from government.
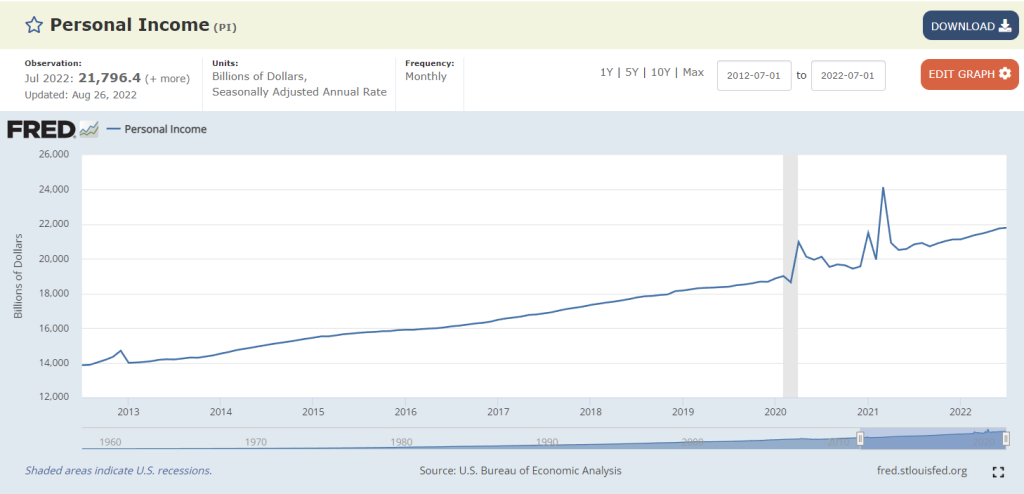
As you can see from the graph above, personal income has been steadily increasing for most of the time apart from a brief period of spike ups and downs.
Food And Energy Prices
The Consumer Price Index (CPI) measures the change in the price of goods and services from the perspective of the consumer. It is a key way to measure changes in purchasing trends and inflation.
A higher than expected reading should be taken as positive/bullish for the USD, while a lower than expected reading should be taken as negative/bearish for the USD.
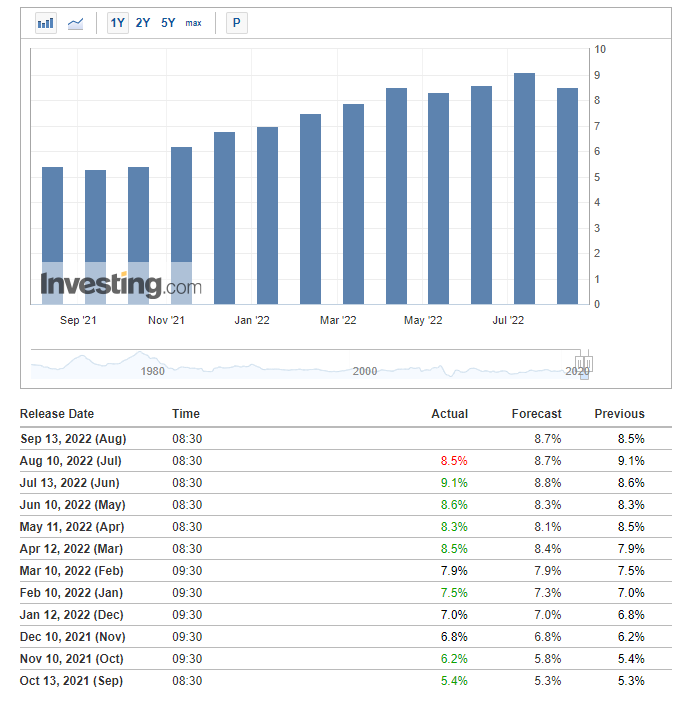
For August, CPI YoY printed lower than forecast for the first time in awhile. This caused DXY to tank and equities and crypto to rally albeit not for long.
If you zoom in closer to CPI MoM data, you’ll notice that “Food away from home” and “Energy” category has start to decline signaling a potential temporary cool off.

These are good news as it means the basic necessities of life (i.e. food) and energy are starting to become cheaper and more affordable than previously.
Real Income
Real income is an economic measure that provides an estimation of an individual’s actual purchasing power in the open market after accounting for inflation. The definition of real income is an amount of money earned and the purchasing power of that money, based on the rate of inflation.
There are three ways to calculate real income as shown.
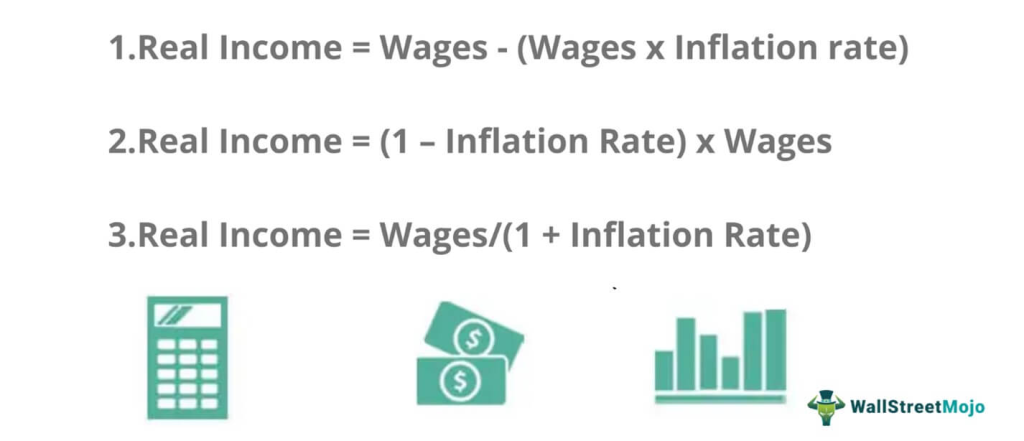
As the rate of inflation subsides, real income naturally trends higher.
Purchasing Power
Purchasing power is the money’s ability to buy goods and services. If the purchasing power increases, the same amount of money will be able to buy more goods. If the purchasing power decreases, that same amount of money can only afford lesser goods now. Inflation causes the prices of goods and services to increase, hence affecting the purchasing power of money. As a result, a person’s real income will be able to buy fewer goods, which translates to a decrease in purchasing power.
From what I’ve gone through with you thus far, we can note that prices are generally coming down in the short-term and the market is poised for an uplift in spirits.
Putting the pieces together and solving the puzzle for you – in simple terms, this means that purchasing power of households increase as real income increase.
When purchasing power increases, households tend to spend more because they can afford to.
What does that mean? Individuals now have more money to throw around. This could lead to a positive reaction in risk-on assets (i.e. equities, crypto).
Technical Analysis
Everyone has been screaming bearish and continues to do so hastily. They are likely right on a larger timeframe as the lows have to be taken out.
In the short-term, however, I would undeniably disagree.
Shorting at the current level right now offers an unfavorable risk-to-reward ratio and is akin to shorting at support.
The move down this time barely had any real volume coming out from it as opposed to the previous two times where it dipped heavily. Note that the magnitude of the move is not as large as the prior but it is evident that volume has remained almost constant signifying no real selling occurring.

Here comes the scenario where I’ll be wrong in my analysis – a break of the recent lows will almost definitely guarantee we see USD $16,000 on $BTC. Can that happen? Yes. Is it probable? Not really.
In my opinion, the odds of price dipping lower are far lesser than a revisit back to higher levels from here.
Disclaimer: I am currently long on several alts and they are all risk-free trades already
Closing Thoughts
I’ve always stuck by this tag in the bear market and it has served me well throughout 2022.
“Hold your longs short, and hold your shorts long.”
I believe there will be a relief rally of some sort in the foreseeable future. My bet is on a halt in the slump in GDP readings as well as a flat or lower CPI data.
If I have to point out the levels, I would say price will trend higher from here and reverse around USD $27,500 – $30,000 on $BTC. That could be the turning point where shorts and heavy rejections start to pile up again.
Then, the narrative of a disastrous economy will be back again.
Also Read: BTC Down 57% As USD Climbs 17% – How The Dollar And Equities Affect Crypto
[Editor’s Note: This article does not represent financial advice. Please do your own research before investing.]
Featured Image Credit: Chain Debrief