Technical analysis is the process of examining current price charts of specific cryptos in order to predict which way such crypto will move next. Although this may be a useful tool in analyzing price action in the short run, projects are likely to drop off without fundamentals in the long term.
The Relative Strength Index
The RSI is one of the most popular and versatile technical indicators. Mainly used as a contrarian indicator where extreme values signal a reaction that can be exploited. It can be referred to as a momentum indicator used in technical analysis.
RSI measures the speed and magnitude of a security’s recent price changes to evaluate overvalued or undervalued conditions in the price of the security. In fact, it does more than just that. Traditionally it can also indicate securities primed for a trend reversal or corrective pullbacks in price.
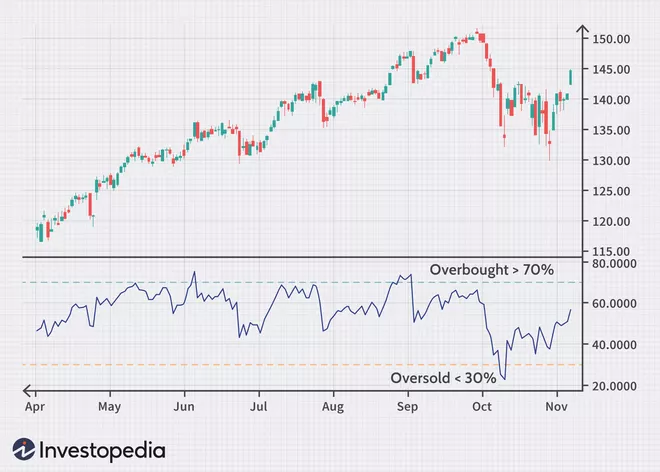
In essence, it is a signal when to buy and sell. A reading of 70 or above indicates an overbought situation while readings below 30 and below indicate an oversold condition.
In a bull market, the RSI indicator can stay within the overbought region for extended periods of time. On the flip side, it may remain in the oversold territory for a long time during a bear market. Ideally, you would want to position your trades, but when it is oversold or sell when it is overbought.
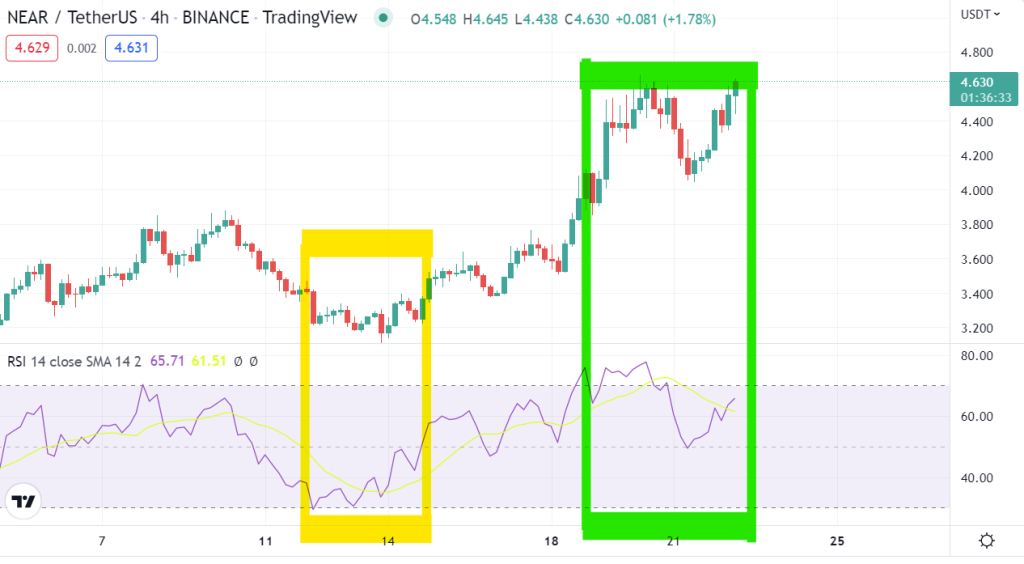
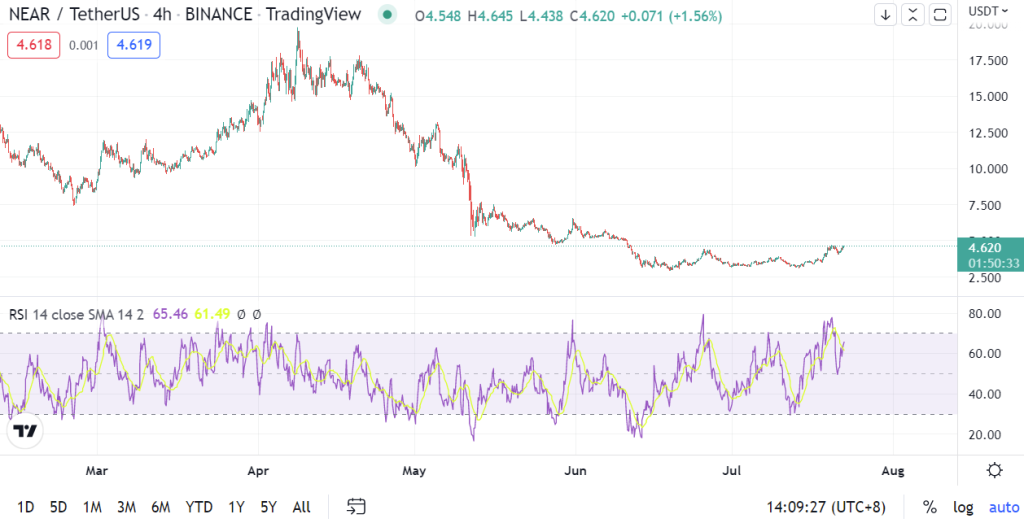
Applying RSI on $NEAR when executing your trades within oversold and overbought zones may be beneficial in identifying trends to buy and sell.
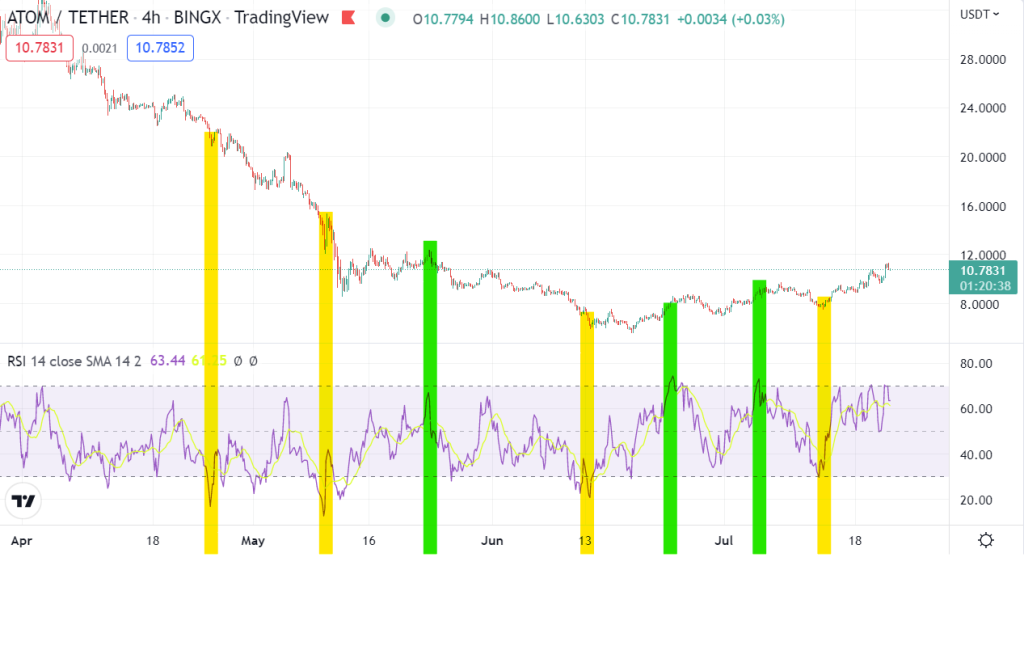
This example for $ATOM shows similar sentiments in how beginner traders will be able to trade with the RSI index. However, the relative strength indicator is not as reliable in trending markets as it is in trading ranges. In fact, most traders understand that the signals are given by the RSI in strong upward or downward trends often can be false.
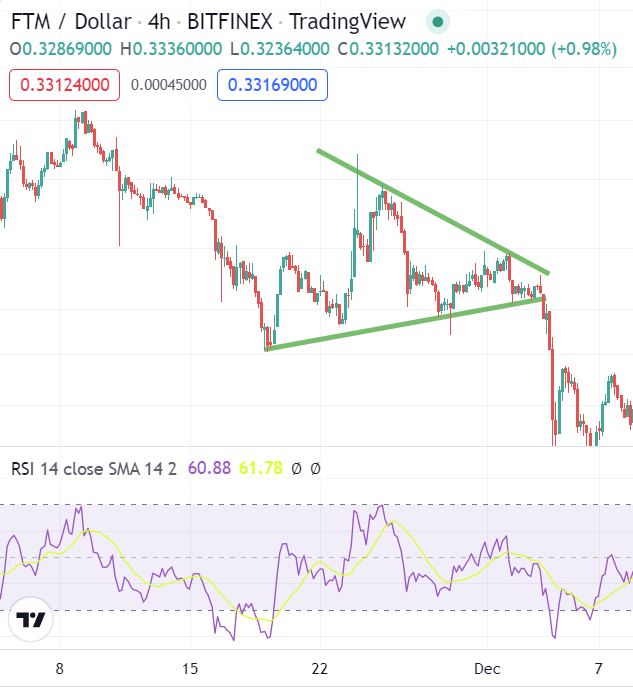
For a more effective TA, coupling the RSI index with support and resistance analysis may give you better insights into trends. Here, $FTM entered a descending triangle formed by the green lines, traders would identify this as a bearish pattern and execute trades in shorting when the RSI are at overbought levels.
Find out how to Identify Support and Resistance here.
RSI Divergence
An RSI divergence occurs when the price moves in the opposite direction of the RSI. In other words, a chart might display a change in momentum before a corresponding change in price.
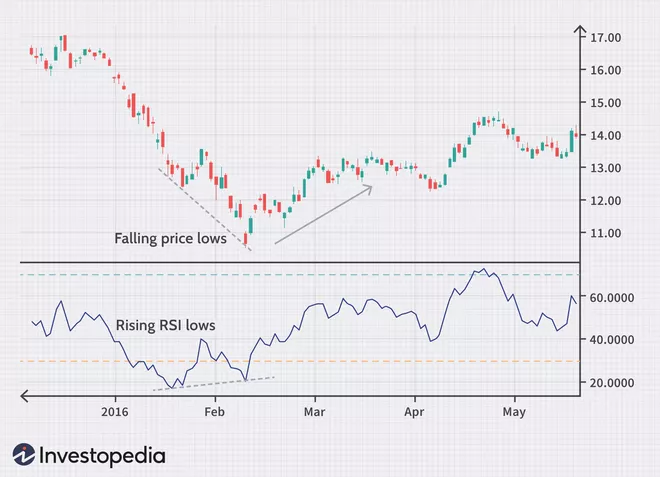
As you can see, the bullish divergence occurs after the RSI shows an oversold reading followed by a higher low as seen on the dotted line in the RSI chart above. This may indicate a bullish momentum, a break above oversold territory (along the orange line) could be an indicator for traders to execute a long position.
Should I Buy When RSI Is Low?
Some traders view a digital asset’s RSI value falling below 30 as a buy signal. Based on the notion that the asset has been oversold and is thus ready for a rebound. However, the reliability of this signal will depend in part on the overall context. If the security is caught in a significant downtrend, then it might continue trading at an oversold level for quite some time.
However, the reliability of this signal will depend in part on the overall context. If the security is caught in a significant downtrend, then it might continue trading at an oversold level for quite some time. Traders in that situation might delay buying until they see other technical indicators confirm their buy signal.
What Happens When RSI Is High?
As the relative strength index is mainly used to determine whether a security is overbought or oversold, a high RSI reading can mean that a security is overbought and the price may drop. Therefore, it can be a signal to sell the security.
However, there may be false alarms if RSI is being used purely. RSI is most useful in an oscillating market (a trading range) where the asset price is alternating between bullish and bearish movements.
Moving averages
Moving Averages are also often used to identify support and resistance along trends. Typically, either a simple moving average (SMA) or exponential moving average (EMA) is used.
The SMA tracks the average price of a cryptocurrency over a period. This creates an easily visible line and helps to screen out the ongoing volatility.
EMAs are similar but place a higher emphasis on recent prices. They, therefore, provide more timely data and are the preferred moving average for many traders.
The most common time periods used in moving averages are 15, 20, 30, 50, 100, and 200 days. The shorter the time span used to create the average, the more sensitive it will be to price changes.
Golden and death cross
A golden cross occurs when a short-term moving average crosses over a major long-term moving average, representing a bullish trend.
On the other hand, a death cross represents a bearish signal which occurs when the short-term moving average crosses below the major long-term moving average.
These two signals can be seen evident across price action for crypto. Here, we see how the golden and death cross affects $BTC based on the 50MA and 200MA.
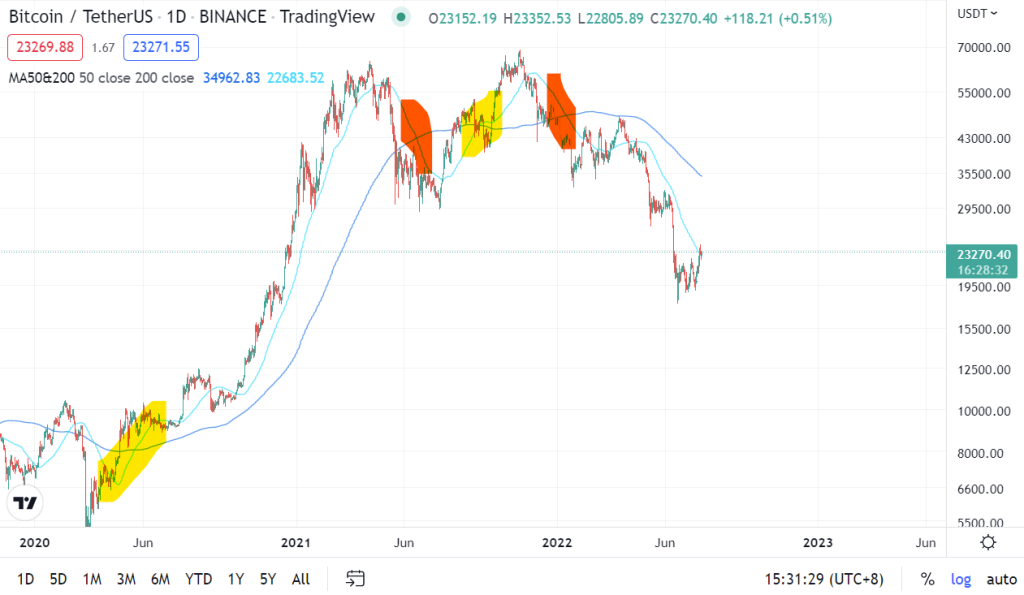
In June of 2020, we saw the formation of a golden cross (highlighted in yellow) which instigate the bull run and rocketed the price of $BTC to its all-time high of US$65K. Death cross awaits after the 8-month bull run, pulling back $BTC 55% from its all-time high to US$29K.
Currently, we are still feeling the backlash of the death cross which happened on the 13th of June 2022. Spiralling the price of $BTC by 73% to a low of US$17K.
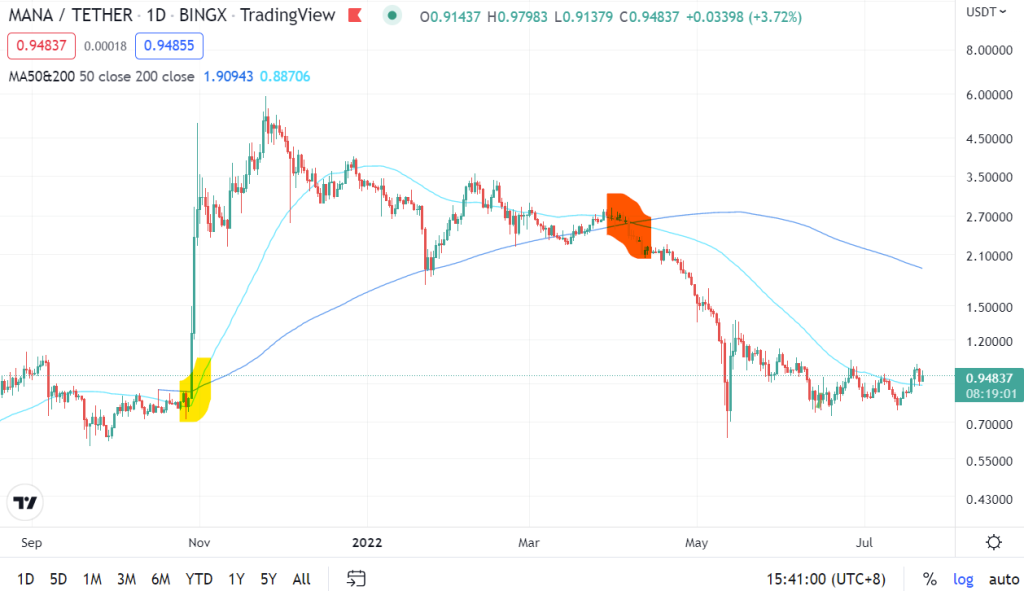
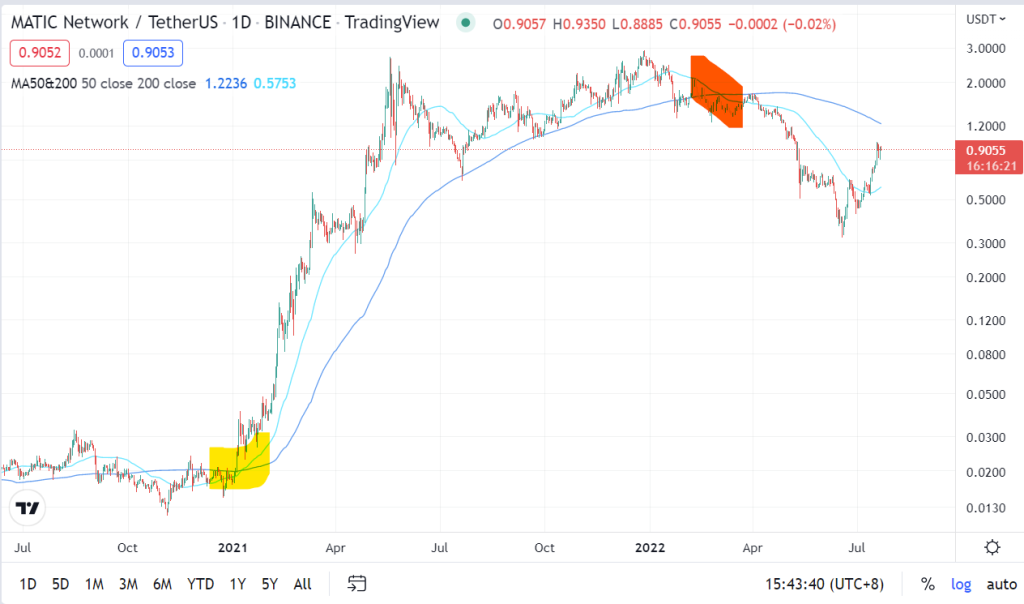
Here are other examples of cryptocurrencies experiencing their “glory” days and meeting “death” along the way.
Closing thoughts
If it was that simple, everyone would be rich. The reality often comes with much more complexity along with additional levels of indicators you need to be on top of. Being able to understand the basics of RSI and MA is a crucial step in utilizing technical analysis for any of your future investment decisions regardless of a long-term hodl or a short-term trade.
[Editor’s Note: This article does not represent financial advice. Please do your own research before investing.]
Featured Image Credit: Chain Debrief
Also Read: Technical Analysis Basics – How to Identify Support and Resistance