If you have ever traded any form of cryptocurrency, this one question is more than likely to have surfaced.
“When is a good time to buy?”
While some may flock to social media for the answer, learning to identify these levels by yourself is essential in the long run. Support and resistance levels are important factors for this and come in varying forms.
Also Read: Bitcoin Tests The Conviction Of Crypto Holders; When Will BTC Bottom?
Understanding Support and Resistance
According to Investopedia, support is a “price level where a downtrend can be expected to pause due to a concentration of demand”.
Essentially, they are zones where demand consistently exceeds supply, or there are more buyers than sellers, and vice versa for resistance. This can serve as good entry or exit points, depending on which side of the trade one is on.
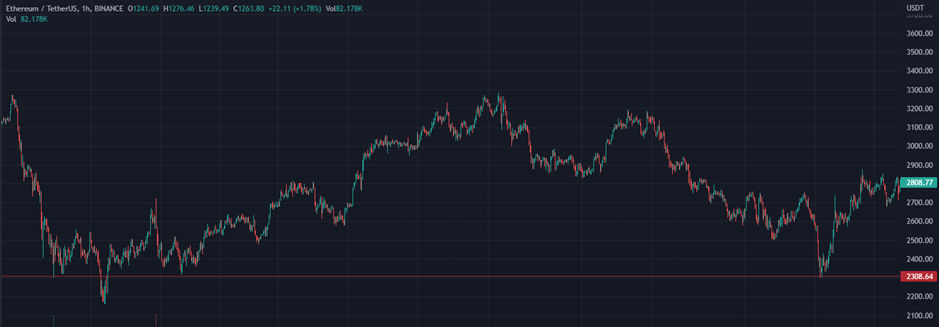
During the bull run, $ETH prices found strong support at the $2300 level. If a trader identifies this, they can buy $ETH within that zone and sell at higher prices.
Support and resistance levels are useful in identifying key points for directional bets. If price action breaks these levels, the trade can often be closed at a small loss, but there is also the opportunity for strong bounces.
Types Of Support and Resistance
Horizontal levels are good starting points, but support and resistance come in many forms.
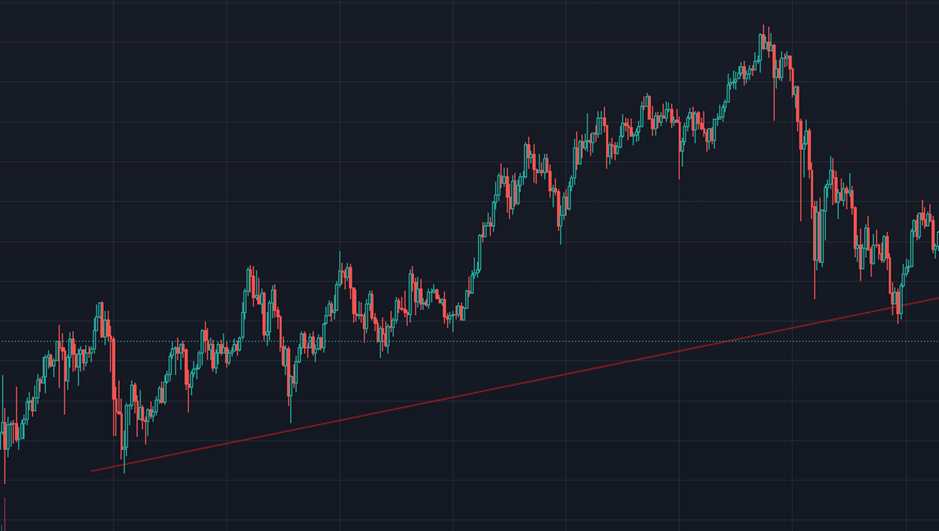
Trendlines are a step up and establish key areas, especially in a directional market.
Here, $ETH is trending upwards, and a support level is formed at the red line. This occurs as there is demand whenever prices fall to a certain level. Traders can buy or open longs here, betting on the trend continuing further upwards.
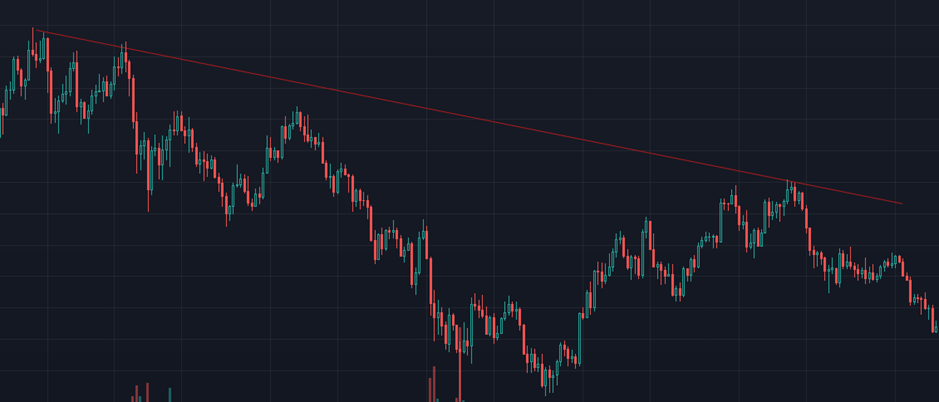
The inverse is true for resistance. Here, we see $ETH on a downwards trend, and a resistance formed at the red line. Traders can use this information to enter shorts or take profits on their long positions.
Moving Averages are also often used to identify support and resistance along trends. Typically, either a simple moving average (SMA) or exponential moving average (EMA) is used.
The SMA tracks the average price of a cryptocurrency over a period. This creates an easily visible line and helps to screen out the ongoing volatility.
EMAs are similar but place a higher emphasis on recent prices. They therefore provide more timely data and are the preferred moving average for many traders.
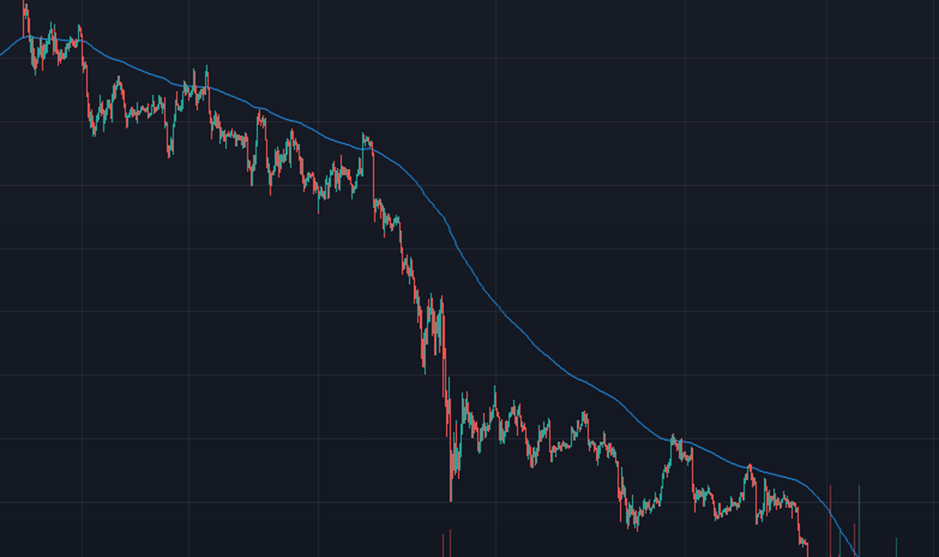
Here, the 200-period EMA on the 2-hour chart acts as resistance for $ETH. The moving average can be customized to fit a certain period, as well as used with other moving averages as a stronger indicator.
Key support levels can also flip into resistance levels, and vice versa. This can be used to identify shifts in trends, and therefore requires an open interpretation.
Putting It Together
A single indicator is a strong starting point for figuring out where to buy and sell, but by using multiple support and resistances together, we can achieve a more complete picture.

Here, both support and resistance are established on the $BTC daily chart, forming an ascending channel. By entering at the lower trendline and exiting at the upward trendline, clear entry and exit points can be noticed.
Furthermore, price action that breaks the channel can also be used as an indicator. Should support or resistance be breached, it can also lead to a strong continuation move in the respective direction.
On the macro level, one of the most accurate signals for market direction is the bull market support band. The indicator uses a combination of the 20-week SMA and 21-week EMA to establish major support levels for $BTC, and the whole crypto market in general.
Should $BTC break downwards, it likely signifies bear market coming, and vice versa.
The bull market support band can therefore be used as a strong indicator of how to approach the market. Once a bullish retest occurs, it may be time to go risk-on again.
Closing Thoughts
Being able to identify support and resistance levels are fundamentals everyone in the crypto space requires. Even non-traders should have some level of technical analysis skills to identify good times to accumulate or take profits.
However, these are lagging indicators that simply screen out the noise. To achieve more complete information, further benchmarks such as RSI, volume, and strong macroeconomic fundamentals are needed.
Regardless, support and resistance levels are good eye tests of current market directions. The ease at which it can be used and applied makes it a good introduction to technical analysis.
Also Read: Market Cycles In Crypto: How To Identify Tops and Take Profits