Volume is an important indicator that every crypto trader should understand. Especially in the world of crypto and across the equities market, this indicator is prevalent and often taken as a reference.
Volume is often confused between the two major terms being thrown around; On-Chain volume and Trading volume.
While on-chain volume refers to the number of valid transactions made on a blockchain, trading volume refers to the transactions which occur off-chain in centralized exchanges like FTX and Kucoin, among many others.
Now you got a rough difference between the two, we will be delving into trading volume, nd how volume as a trading indicator can be used to assist any execution of trades.
What is On Balance Volume?
On Balance Volume (OBV) measures buying and selling pressure as a cumulative indicator that adds volume on up days and subtracts volume on down days.
When the security closes higher than the previous close, all of the day’s volume is considered up-volume. When the security closes lower than the previous close, all of the day’s volume is considered down-volume.
In essence, you would want to focus on the direction instead of its actual value.
How this indicator works
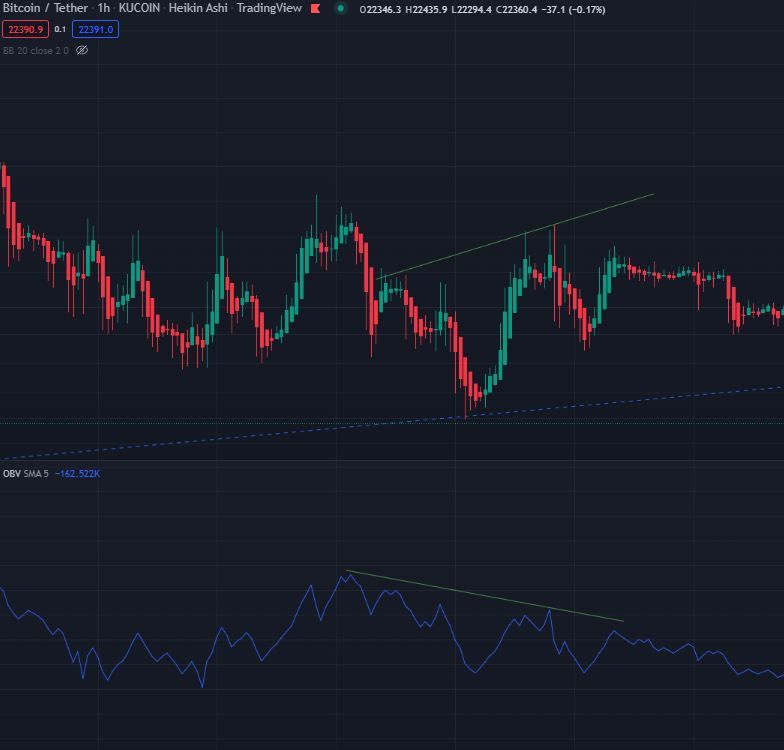
As seen in the chart below, I’ve drawn 2 twoupport lines, one on the prasset’s price actionnd and the other on the OBV indicator itself.
In an upwards trend
The upward trend is likely to continue when the upward trend is likely to continue whenoth price and OBV are the upward trends is expected to continue.
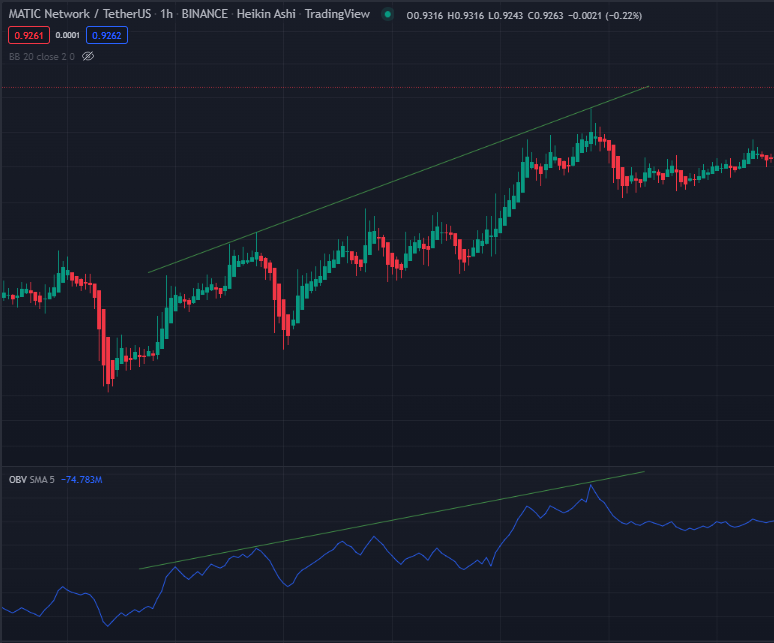
A rising OBV may beresult fromn accumulation phase and could signal an upwards breakout.
In a downward trend
WhThe downward trend is likely to continue whenotthe h price and OBV are making lower peaks and lower troughs, the downward trend is expected to continue.
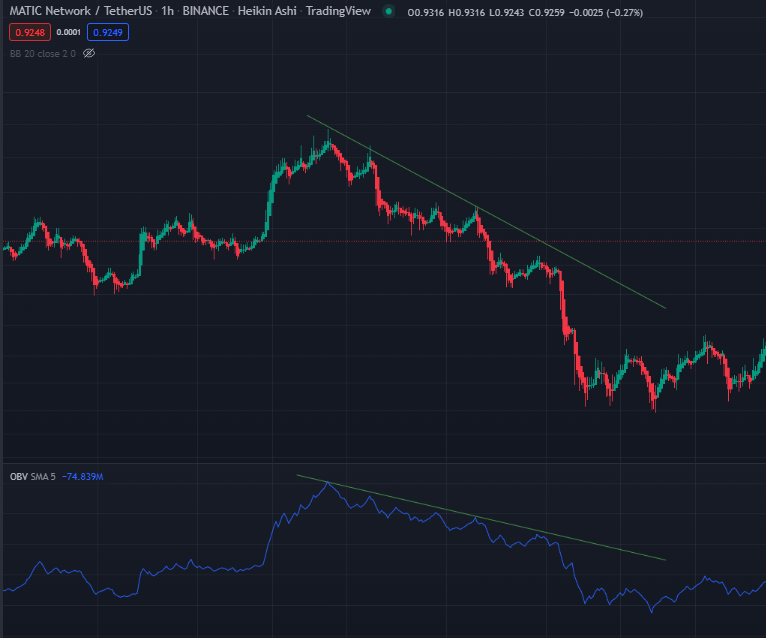
A falling OBV may beresult from distribution phase and could signal a downwards breakout.
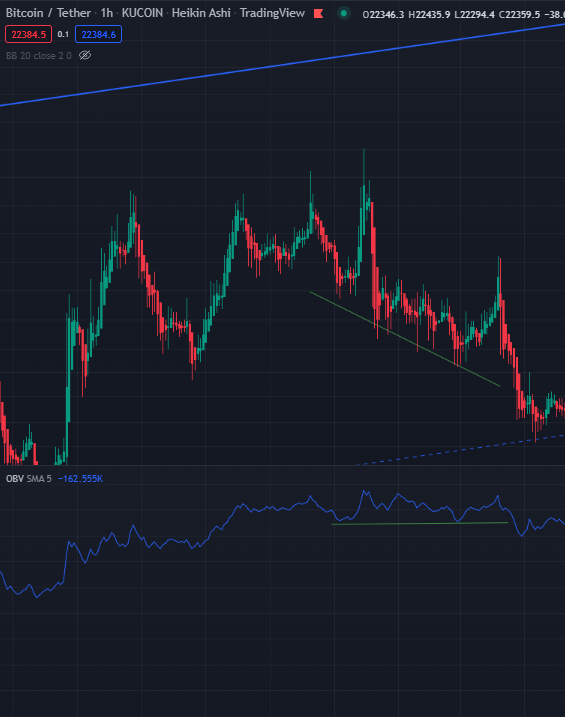
Positive Divergence
The downward trend will likely stall or fail when the price continues to make lower troughs, and OBV fails to make lower troughs. This is called a positive divergence.
Negative Divergence
The upward trend is likely to stall or fail when the price continues to make higher peaks and OBV fails to make higher peaks. This is called a negative divergence.
Closing thoughts
This is a reasonably simple indicator that you may find helpful in pairing with other predictive indicators like the Bollinger bands or the triple threat combo. E.g. Using the MA line and OBV could reveal obvious breakouts in price.
One thing you should note, though, is how whales can manipulate the market with their significant funds. Especially in crypto, this might cause a massive spike in trading volume and throw the indicator “off”. If you solely rely on it, it may deceive you into making wrong decisions based on trends.
Also Read: This Is Only The Beginning For Ethereum; An Ultimate Guide For The Merge
[Editor’s Note: This article does not represent financial advice. Please do your research before investing.]
Featured Image Credit: Chain Debrief