After two-weekend market rallies, we see the crypto market cooling off in the way of a retracement. Short squeezes in January and rising narratives gave investors hope for upside movement. While this sets a positive tone for what is to come for the rest of the year, in the short term, uncertainty remains as the macro conditions loom as the puppet master in the direct crypto will move.
I look into five charts in Arcane Research’s market research and found insights regarding the current state of the crypto market and what the upcoming week in cryptocurrency may hold.
99% certainty of a 25bps interest rate hike
If it is 50bps, the market will knock on the doors of hell’s gate.
As with all other interest rate hikes comes volatility, and today’s will be no different. While the recent deflationary economic data in January caused positive sentiments in the market, a pivot is likely in the coming months. A downward-tending inflationary score recently saw signs of market recovery, and with that, Jerome Powell is expected to maintain a hawkish stance.
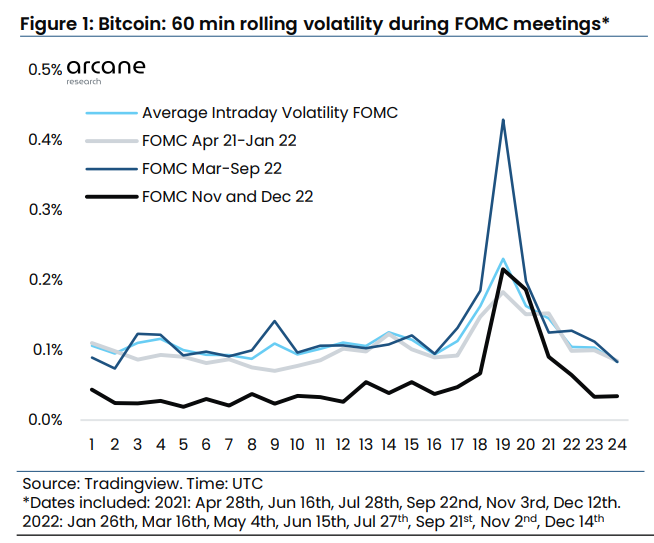
Acrane research also drafted that recent volatility over the past FOMC meetings has simmered from the “aggressive hiking cycle from march to September 2022.” Those were the days my bags got rekted.
Find out how one of our senior trading analysts and the lord supreme Commander has been trading the CPI with a 100% win rate.
High risk higher rewards with small caps
The 30d weighted indexes performances of market cap show that small caps took the throne. While this may come with significant risk, its recent performances to the start of 2023 outperformed all other indices, which all moved similarly to Bitcoin.
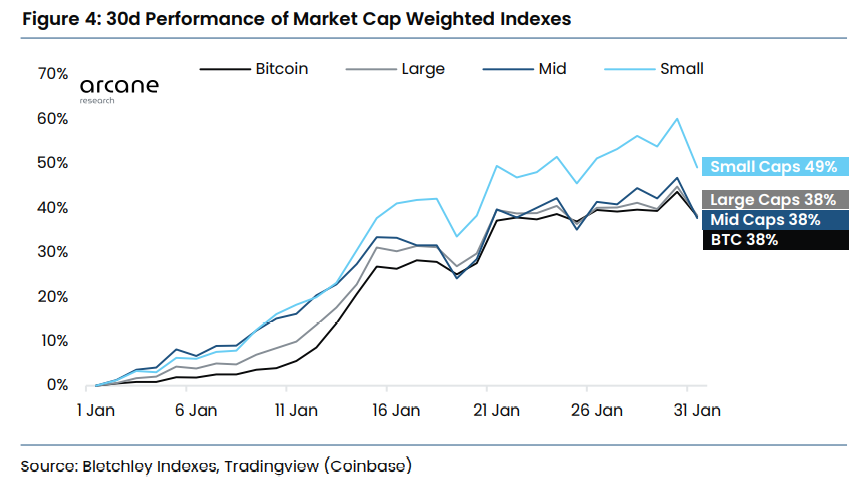
These small caps mainly come from projects related to heated narratives such as AI, LSD and DEX. It is safe to say the majority of these tokens are narrative-driven, and often times after the dust settles, so would the price. High risk, higher rewards.
Particularly for small caps, we look into under-the-radar projects in the latest and upcoming narratives in crypto. Bittensor for AI, $CAP and $GNS for DEX and Rocket Pool for the LSD narrative are some we looked into riding their respective trends.

However, we could expect to see a retracement in the current overheated market in the short term. Long-term though, an opening for an opportunity to average in my current positions.
On-chain metrics reveal so much more.
According to Arcane research, “derivatives more or less always carry a clue of overheating in the market or full-on depression. It’s highly actionable and worthwhile understanding if you aim to be an active crypto market participant.”
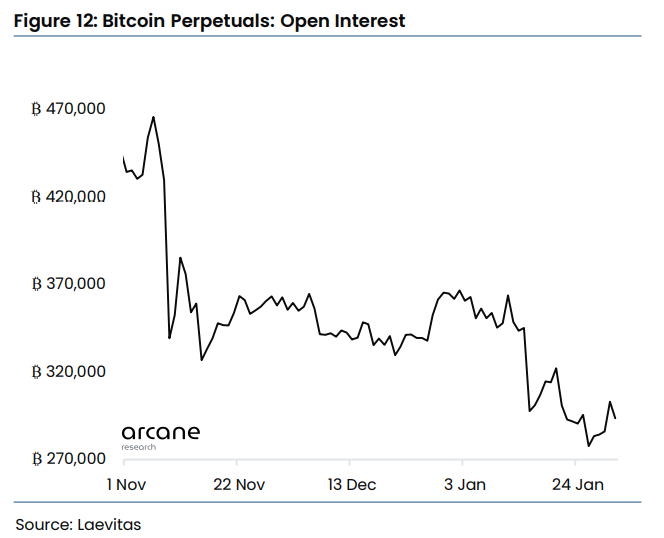
1. Open interest
Monitoring open interest helps you gauge the volatility of the market; some may refer to this on-chain analytics as a proxy for how big a volatility spike will be.
The new year observed January suggesting a shift in dynamics. Instead of shorts dominating the longs, as seen at the tail end of 2022, the sentiments are changing for the better. Right now, the longs seem to be growing in dominance in anticipation of further upside, while shorts are slowly stepping away.
Currently, the open interest is cosy at an all-time high value, which may result in big movements in breakouts after a long period of market moving sideways.
Could this be a signal for more upwards movement? Only time will tell, but I will remain optimistic until the insolvency contagion, and macro outlook have settled.
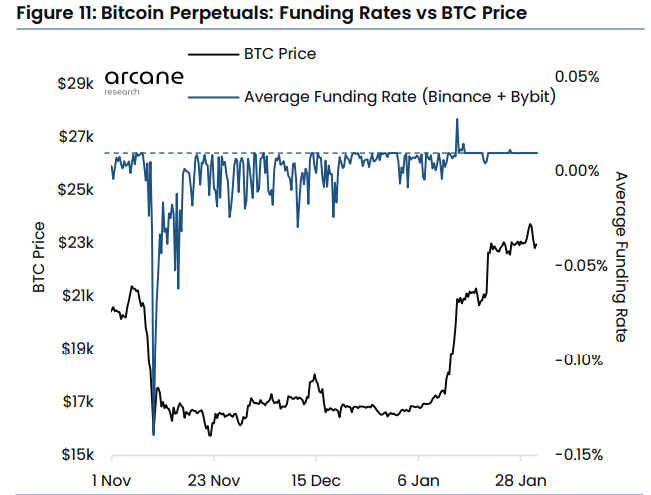
2. Funding rates
In a bull market, funding rates tend to be pushed to extreme ends with the great demand for long positions. Bascially, being in a long place in a bull market will be more expensive than being in a short—Vice-versa for a bear market.
Funding rates also give us an idea of how to act on market movements and liquidation cascades. In some cases, it could provide insights into a potential short or long squeeze.
Currently, the funding rate against BTC price is flat, which could reflect buyers now are long-term believers. The last time we saw a neutral stat like this was from December 2021 to early January 2022. However, even with idle funding rates, the trading volume in the spot market show opposing sentiments, where activity remains high.
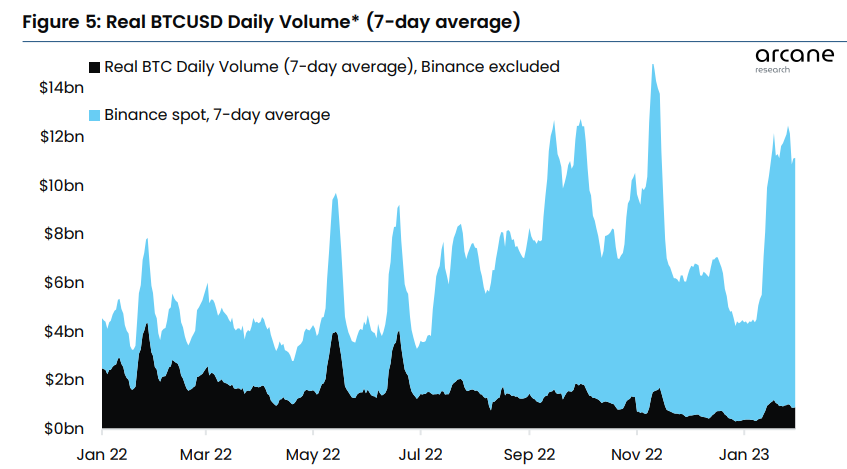
3. Volume
Looking at the spot volume is one way we can understand the general activity in the market – the higher the volume, the more BTC is being traded. Looking close may give you some insights to identify market bottoms and tops.
What usually happens when volume falls is the stabilizing of prices, but Acrance research noted an exception to that rule last week, where “prices mostly ranged in a tight range near $23,000 while
volumes remained elevated.”
The current BTC volume hovers closely at the $10B range over the past three weeks.
TLDR
Expect 25bps, which might be priced in; if it turns out to be 50bps, we are en route for a thunderstorm.
Narrative-driven small caps have been the market winners but come with significant risks.
Looking at on-chain data will reveal more, but deciphering them is often the hardest challenge.
Open interest tells us that longs are seemingly more popular than shorts.
Funding rates seem… meh, but activity remains high.
Volume is doing something out of its norm, real BTC volume moves sideways while spot volume overheated.
Also Read: Top 10 Protocols For Staking Stablecoins (2023)
[Editor’s Note: This article does not represent financial advice. Please do your research before investing.]
Featured Image Credit: Chaindebrief