If you have ever traded any form of cryptocurrency, this one question is more than likely to have surfaced.
“When is a good time to buy?”
While some may flock to social media for the answer, learning to identify them by yourself is essential in the long run. Chart patterns are an important form of this and come in many forms.
Also Read: Technical Analysis Basics – Moving Averages and Relative Strength Index
Understanding Chart Patterns
Chart patterns, sometimes known as price patterns, are a recognizable configuration of price movement that is identified using a series of trendlines or curves – according to Investopedia.
Basically, traders will recognize patterns and use them, hoping that prices will move similarly.
While this may seem like astrology, price patterns derive their fundamentals from locating pools of liquidity where demand and supply have a strong impact.
By using these price patterns, we can make better guesses as to which direction the market is leaning towards.
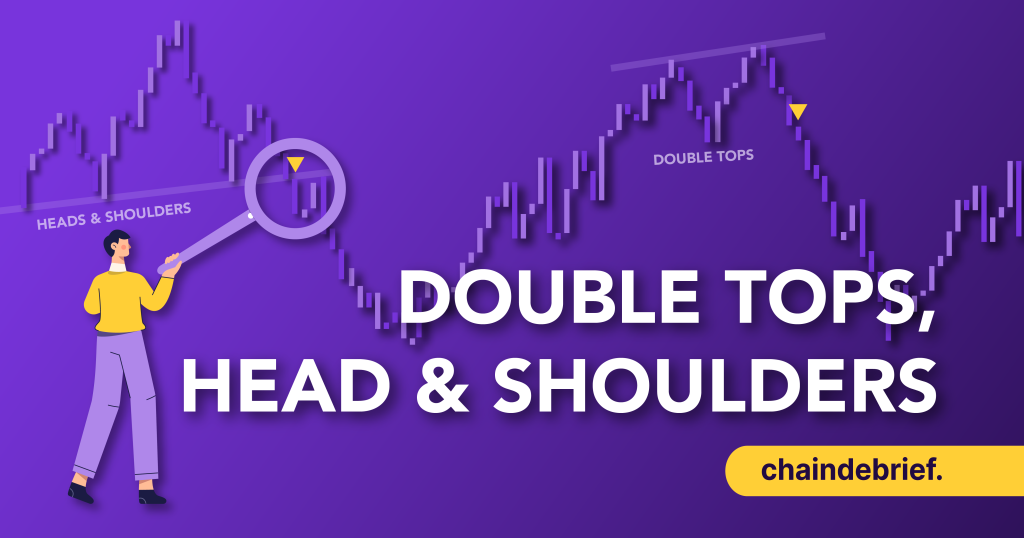
Double Top/ Bottom
One of the best introductions to chart patterns is double tops/ bottoms.
These are represented by price action getting rejected twice from a key resistance level. It often occurs after a break past recent highs.
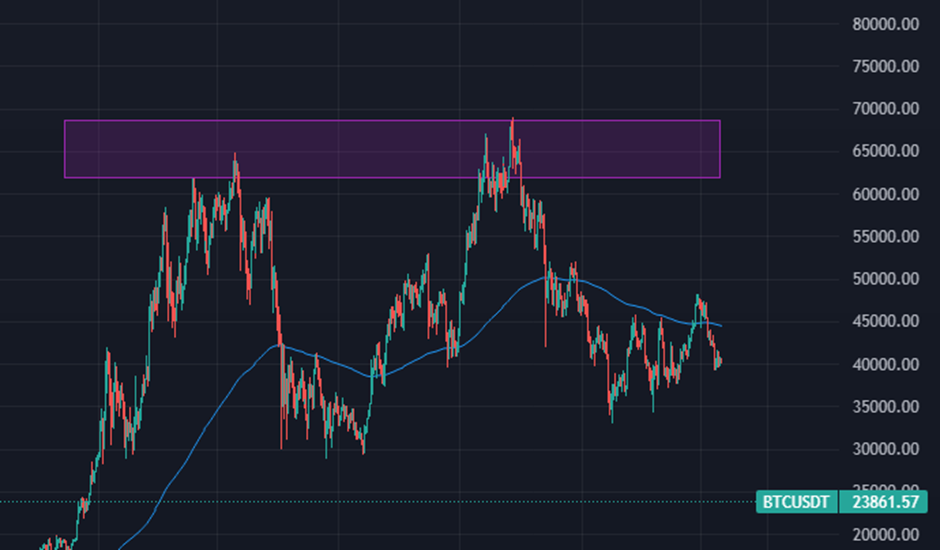
On a macro level, $BTC was rejected from the $69K range twice, which showed clear signs of a top.
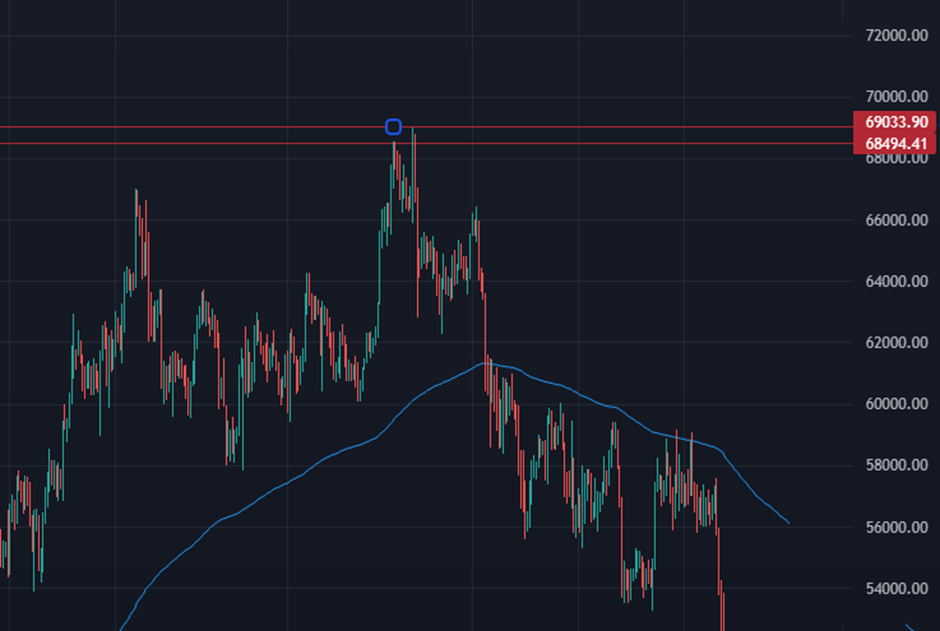
Even on a shorter timeframe, we can see that demand dried up on $BTC as it was trying to break past the $69K range. This subsequently led to a lot of selling, as traders realized that the upside was limited.
Some traders prefer to use a “triple tap” method instead of a double bottom/top, to guarantee that demand or supply has dried up.
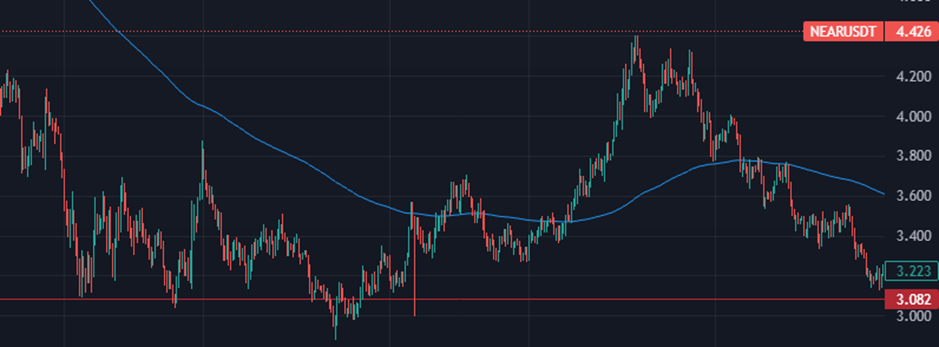
Here, $NEAR taps the $3.082 mark twice, and the price attempts to break out below it. However, once it rebounds from the third tap, a 50% run occurs.
By getting further confirmation on the third tap, traders try to get a higher win rate, even if fewer trades can be placed.
Head & Shoulders
A head and shoulders pattern indicates a bullish-to-bearish reversal, and is identified by three peaks, with the middle one being the highest.
Essentially, they consist of three parts:
- After a bullish phase, price peaks and starts to decline
- Prices rise substantially over this initial peak and declines again
- Prices rise again, but get rejected off the first level.
In between the shoulders are zones called troughs, and the line connecting them is often called the neckline
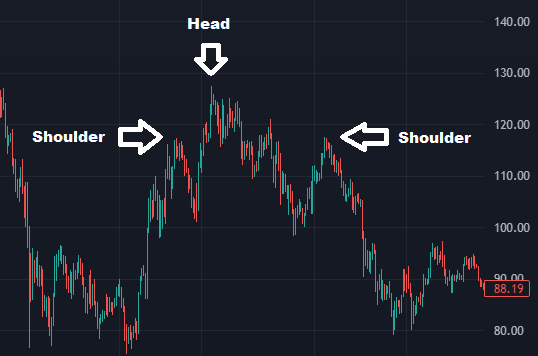
Here, we see a bullish run up from $80 to $118, where prices start to decline and the first shoulder is created.
The second run up creates the head, and the third peak after a substantial decline forms another shoulder. This completes the pattern, and a run back down to $80 subsequently occurs.
Of course, we can also get a bearish-to-bullish confirmation via an inverse head and shoulders.
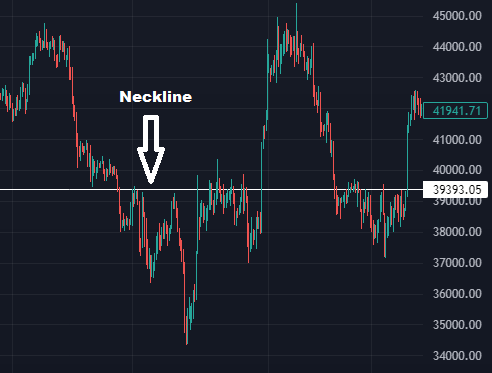
Try to spot it by yourself before reading on!
Here, $BTC starts to form a left shoulder following a bearish fall from $44,000.
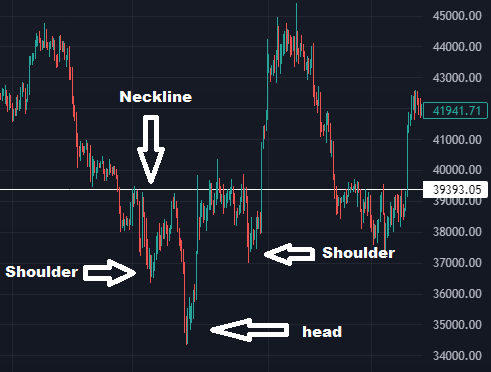
Once it creates the pattern and breaks the neckline of $39,300, we see a run up to $45,000.
Compared to the pattern formed on $AVAX, there is no retest of key resistance levels here, and we see a bullish pattern immediately.
While head and shoulders are one of the most reliable technical analysis tools to have, it must also be said that they do not come often.
Closing Thoughts
Being able to identify such patterns are fundamentals everyone in crypto requires. Even non-traders should have some level of technical analysis skills to identify good times to accumulate or take profits.
However, these are lagging indicators that simply screen out the noise. To achieve more complete information, further benchmarks such as RSI, volume, and strong macroeconomic fundamentals are needed.
Regardless, both patterns are good eye tests of current market directions. The ease at which it can be used and applied makes it a good introduction to technical analysis.
Also Read: Technical Analysis Basics – How to Identify Support and Resistance
[Editor’s Note: This article does not represent financial advice. Please do your own research before investing.]
Featured Image Credit: Chain Debrief