The third installation of our technical analysis basics will be on Bollinger bands and the popular Fibonacci retracement. These indicators may help you with your investment decisions, especially in the volatile climate of crypto and when to exit trades.
Bollinger Band®
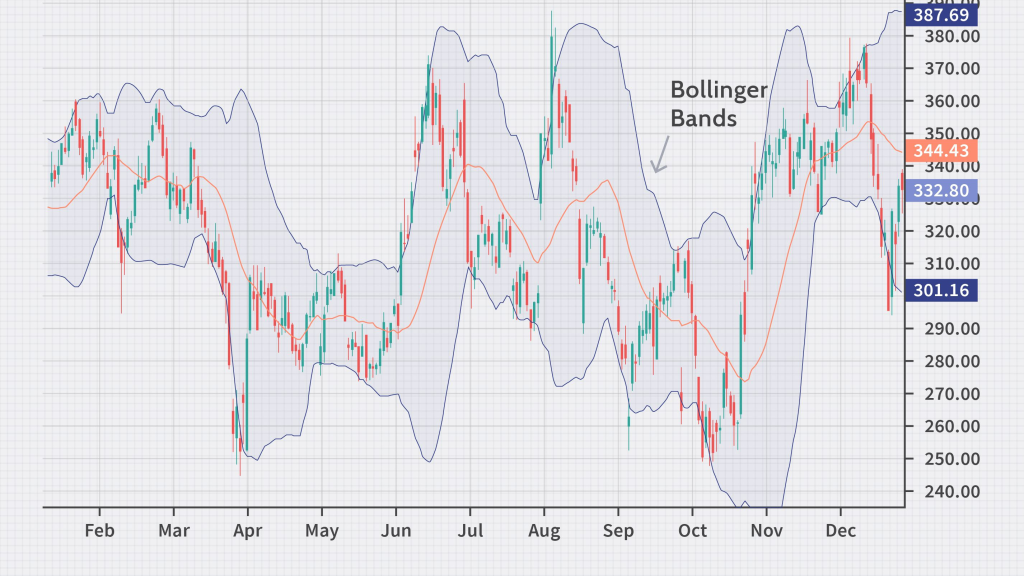
A Bollinger Band® is a momentum indicator used in technical analysis that depicts two standard deviations above and below a simple moving average.
Read More: Technical Analysis Basics – Moving Averages and Relative Strength Index (RSI)
Bollinger Bands shows different highs and lows that a crypto price has reached in a particular duration and its relative strength, where highs are near the upper line and lows are near the lower line.
The analyst would decide on the volatility (number of standard deviation) between the bands, determining the distance between the middle and upper bands.
How strong or weak the trend is will be determined by the position of these bands which may be expected in the immediate future.
Upwards trend
The Bollinger band is a good indicator in showing how strong an asset is rising or on the flip side when it’s losing strength.
An uptrend that reaches close to the upper bands shows that the asset is pushing higher and traders may want to use this opportunity to make a buy decision.
When the price pulls back within the uptrend and stays above the middle band, it is an indicator of a lot of strength.
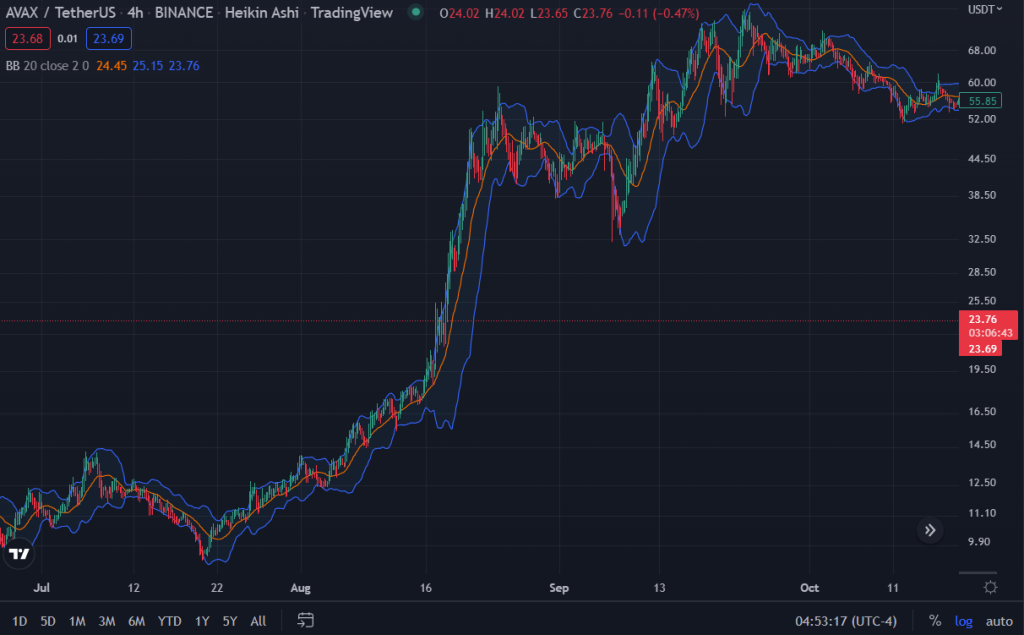
AVAX above showed great strength with the Bollinger band, entering at the price level of $16.5 and riding the uptrend signal (price maintaining within the upper and middle band) to a high of $60, a decent 3x.
Generally, the price of the asset should not touch the bottom band in an upwards trend. If it does it could be a warning signal for a reversal or a narrative shift. Traders would avoid incurring losses from a reversal and usually exit their positions.
Downward trend
Trading using the Bollinger bands may reap some benefits when used correctly. It can show how strongly an asset is falling after a potential reversal from an uptrend.
In a downward trend, the price will run along the lower band, which shows a high selling indicator. However, when the price fails to touch or move along the lower band, it may be an indication that the downward trend may be losing momentum.
When Bollinger is treading along the lower band, it would be wise for traders to avoid entering into a long trade.

Limitations of Bollinger Bands
This indicator may be a helpful tool for trades however there are a few limitations that we all have to consider before using them.
As the bands react to price movements, either in an upward or downward trend, the bands react to changes in price movements. This also means it is a lagging indicator as it is a tool based on moving average, which takes the average price of several price bars.
Although a good tool to gauge trends, using this tool with another indicator may be a wise choice. Recommended by John Bollinger himself on using two to three non-correlated tools to provide a more direct market signal in influencing your investment decisions.
Bollinger Bands also reveal a trading pattern in trading at W bottoms and M tops.
Fibonacci Retracement
The almighty Fibonacci. Legend has it is the rule of life. Others say it is the gold standard in exit and entry strategies. So what is the Fibonacci Retracement?
Fibonacci retracement levels are horizontal lines which indicate possible support and resistance levels where the price could potentially reverse. The first thing to note though is that this tool works best when the market is trending.
It gives the trader a better sense of taking the long or short position whether the market is trending upwards or down.
They are considered a predictive technical indicator in identifying where prices may be in the future. In order to find these levels, we take a closer look into how it plays out in an uptrend.
Upwards trend
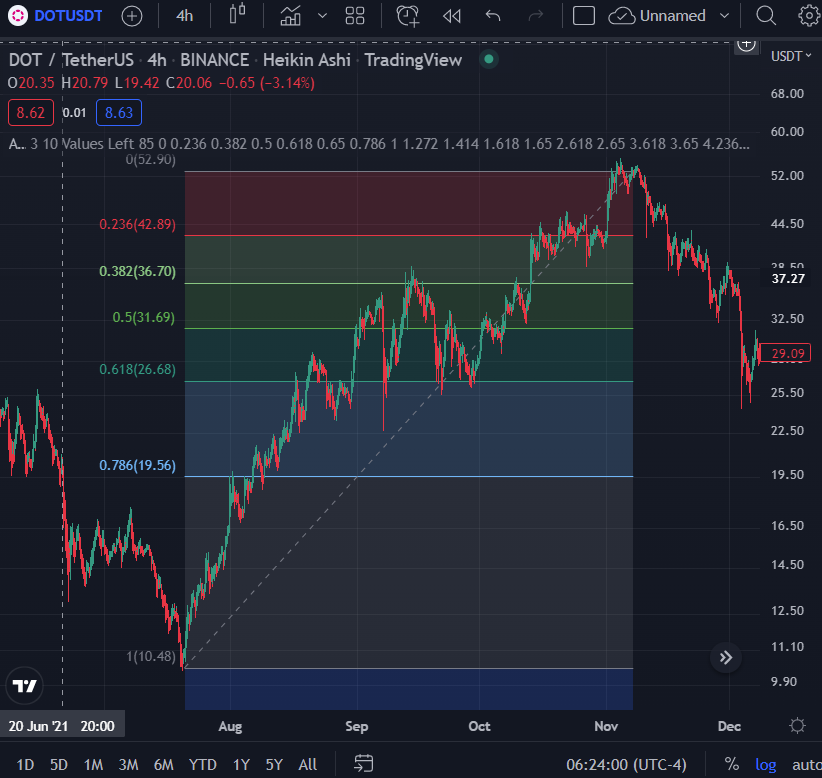
In theory, these lines may come as a series of six horizontal lines drawn intersecting the trend line at the Fibonacci levels of 0.0%, 23.6%, 38.2%, 50%, 61.8%, 78.6% and 100%.
These retracements are identified as support or resistance areas, as you can see the price action of DOT above bouncing and rejecting along those levels of 38.2%, 50% and 61.8% and 78.6%.
These levels can help traders identify the probable extent of the retracement and position themselves for the trade accordingly.
Downward trend
Similarly, the Fibonacci retracement works the same in a downwards trend.
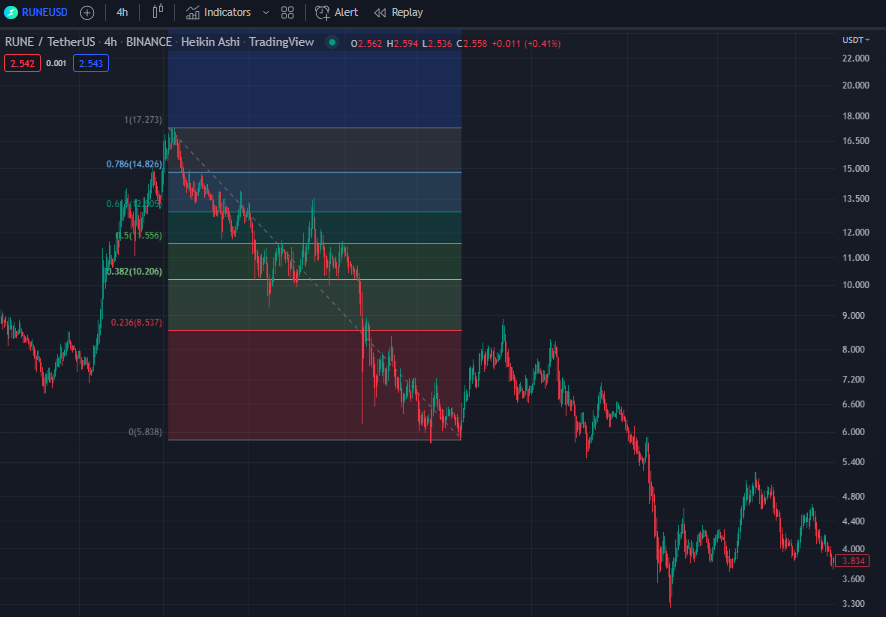
As seen with Rune, making use of the Fibonacci retracement may be beneficial in positioning your exit strategies.
Strategies for trading Fibonacci
There are no strict trading strategies that you should use on your Fibonacci ratios but you need to remember that these retracement lines are often used as part of a trend trading strategy. The idea is that there is a higher chance the price will bounce off Fibonacci levels in the direction of the initial trend.
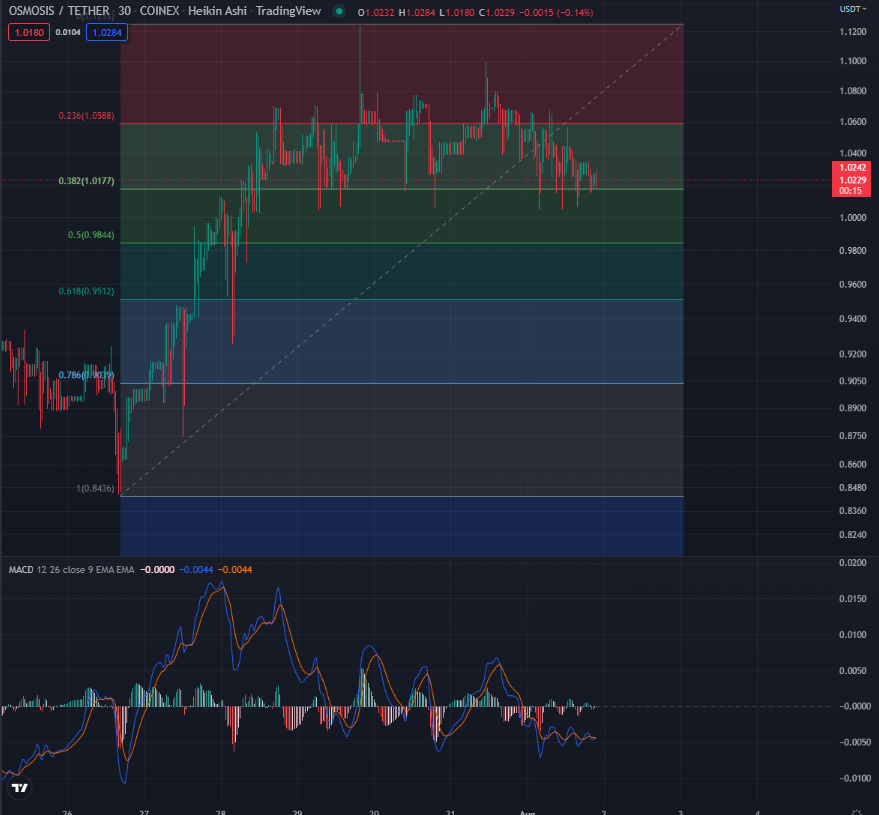
Using the MACD indicator may be a trading strategy you want to employ. This strategy looks for a crossing over the MACD indicator and when the price of OSMO touches a Fibonacci level, a position can be opened in the direction of the trend.
Fibonacci levels can also be used with Stochastic indicators. This indicator will help traders identify overbought and oversold levels. This strategy looks for key signals from the various oversold/overbought zones when the price touches an important level of retracement.
Closing thoughts
The Bollinger band and the Fibonacci retracements are various indicators to employ when you are trend trading. It is important to note that these strategies do not work 100% of the time, one should consider macro factors as well as a combination of other indicators to make a better investment decision during your trades.
[Editor’s Note: This article does not represent financial advice. Please do your own research before investing.]
Featured Image Credit: Chain Debrief
Also Read: Technical Analysis Basics – How to Identify Support and Resistance