The Ichimoku Cloud is a technical indicator developed by Goichi Hosoda and is often used to predict future price movements. It is a combination of technical indicators, especially in levels of support and resistance, that reveals the overall strength and direction of the crypto market.
Not only its aim to predict how high/low the price of the asset will go but also predicts the time period of the increase/decrease.
We take a look into the Ichimoku Cloud strategy and see how effective it is with Crypto.
The set-up for Ichi
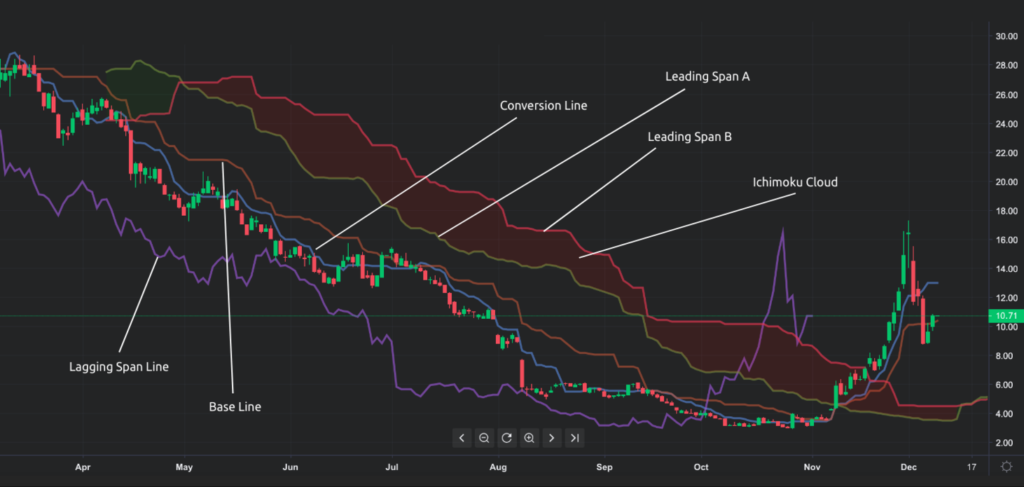
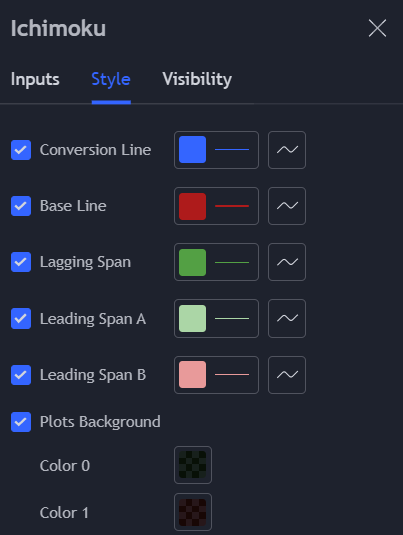
The Ichimoku cloud relies on both lagging and leading indicators with its data. It comprises five main components/lines; Base Line, Conversion Line, Lagging Span, Leading Span A and Leading Span B.
Base Line (Red Line)
Also known as the Kijun-sen line, it is the midpoint of the last 26 candlesticks. This line is calculated using the following formula: [(26-period high+26-period low)/2]
Conversion Line (Blue Line)
Also known as the Tenkan-sen line, it is the midpoint of the last 9 candlesticks. This line is calculated using the formula: [(9-period high+9-period low)/2]
Lagging Span Line (Green Line)
The Chikou Span reflects the closing price of the current period. As its name suggests, the lagging span lags behind the asset’s price and is projected 26 periods into the past.
Leading Span A (Light Green Line)
Also known as the Senkou Span A, it forms the first cloud boundary. The line represents the midpoint between the baseline and the conversion line, plotted 26 periods into the future.
It is also a faster-moving cloud boundary which is calculated with the formula [(conversion line+baseline)/2]
Leading Span B (Light Pink Line)
Also known as the Senkou Span B, it forms the second cloud boundary. The line represents the midpoint between the last 52 periods moving average, also representing the slower cloud boundary.
It is calculated with the formula [(52-period high+52- period low)/2]
Kumo Cloud
The most notable feature of the Ichimoku Cloud is located within the space between Leading Span A and B.
Since both leading spans are plotted 26 periods into the future they are considered leading indicators as they help forecast the future. While the lagging span, plotted 26 indicators into the past, is a lagging indicator.
You will see two colours, money green or down bad red. The leading span B is red while leading span A is green. A red cloud is formed when LS B is higher than LS A, and vice versa, a green cloud is formed when LS A is higher than LS B.
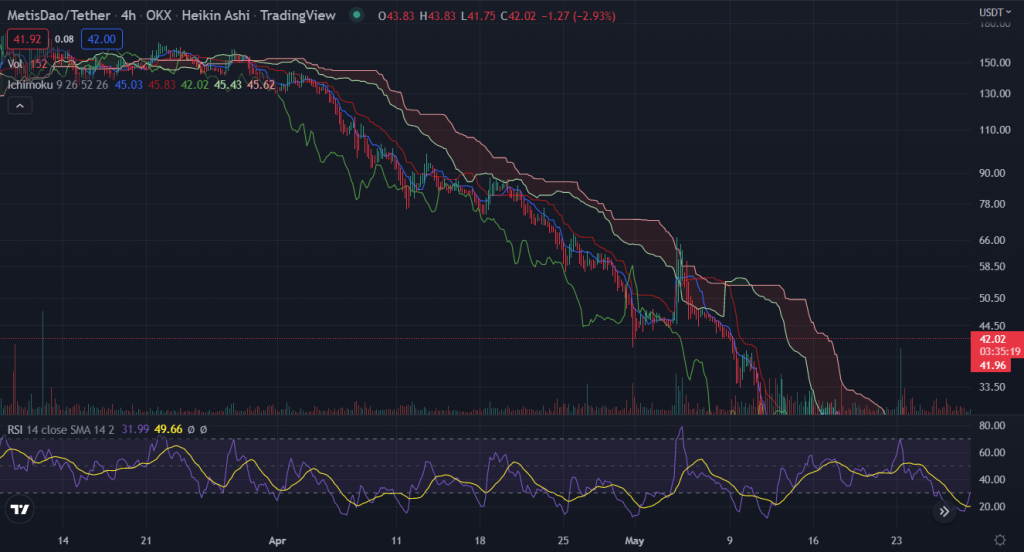
Especially in the volatile nature of crypto, the Ichimoku cloud may be a predictive indicator of market prices.
Intepreting the Ichimoku
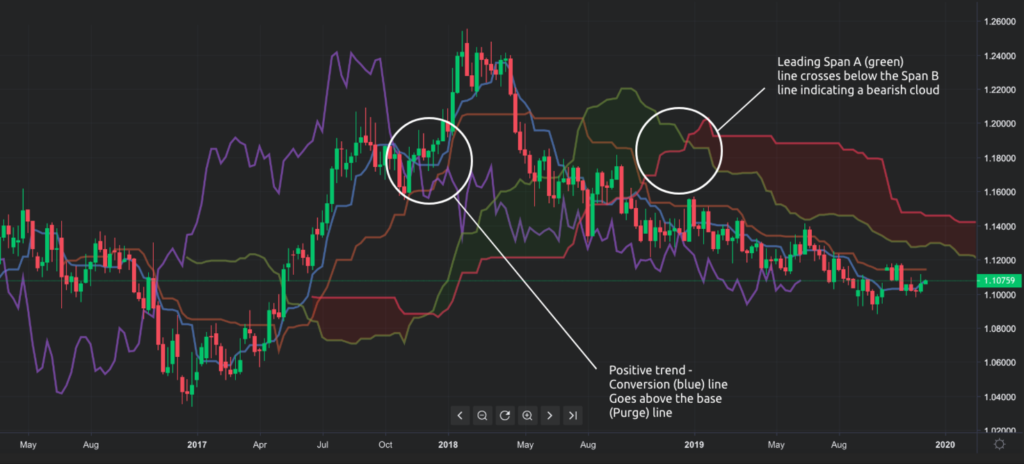
Though it may seem complicated complex, reading the graph may be relatively easy. You start by identifying the LS A and LS B.
When the LS B is below LS A, the asset is moving in a negative direction and the cloud should be red.
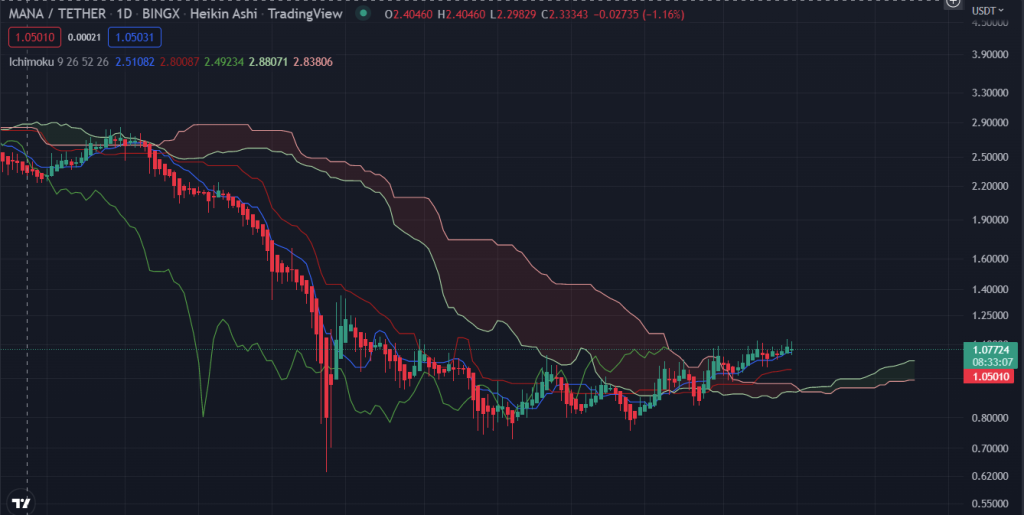
On the other hand, when the LS A is above LS B, it is a sign that the asset is gaining momentum, you will see a green cloud.
Using Momentum Signals
After identifying the clouds, the next set of lines you look at will give you momentum signals. These are generated depending on the relationship between market price, the baseline (Red) and the conversion line (Blue).
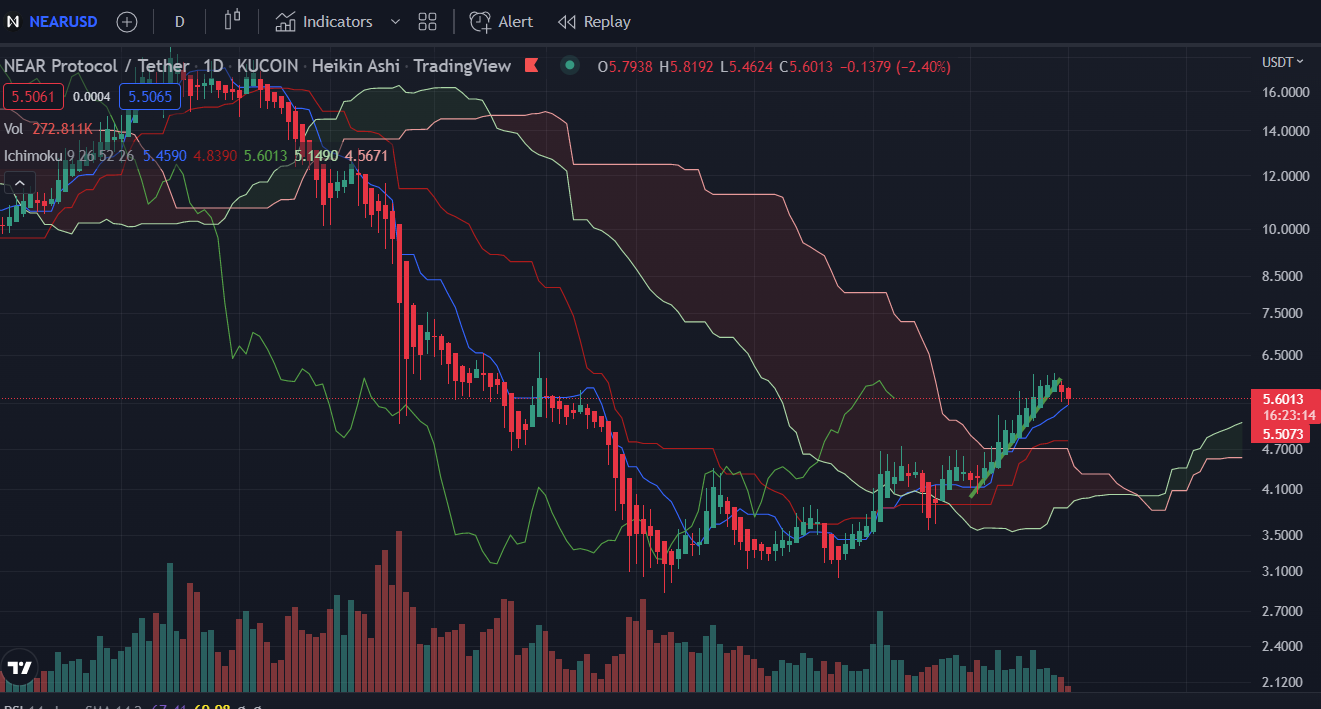
If the market price or the conversion line (blue), or both, is above the base line (red line), it is an indicator of a bullish momentum signal. A bearish momentum signal occurs when with market price or the conversion line (blue) is below the base line (red line).
We don’t have a golden or death cross here, but the TK cross. This refers to the crossing between the Conversion Line, Tenkan-Sen, and Base Line, Kijun-Sen.
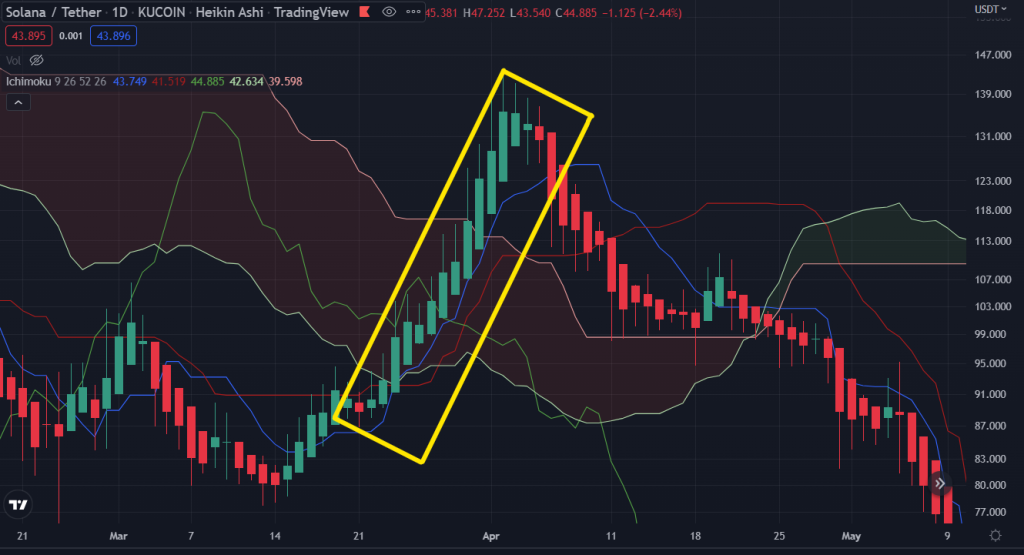
Trend Following Signals
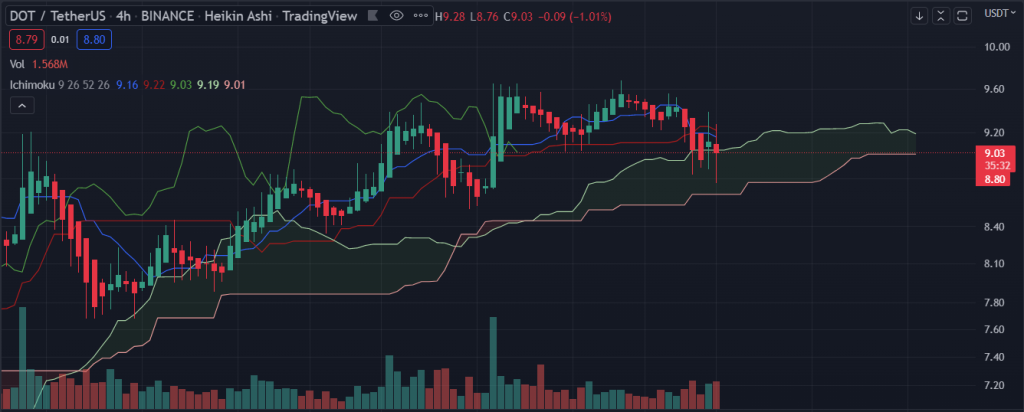
This signal is derived from the position of the market price in relation to the cloud and its colour.
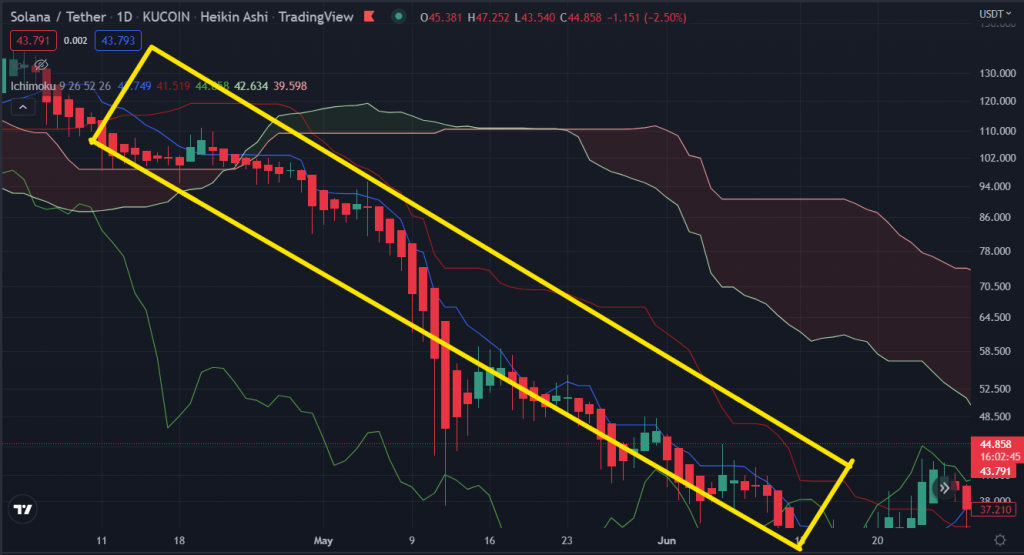
If the market prices are below the cloud, the asset is bearish or in a downward trend. Exceptions to when price action is moving sideways.
When the market prices are above the cloud, the asset finds itself in a bullish or upward trend.
Another way to spot and confirm a trend reversal is the Chikou span, the lagging span. This line will give you insights into the strength of the price action. A bearish trend might emerge if it moves below the market prices and a bullish trend when it moves above the market prices.
Identifying support and resistance
LS A (green) usually acts as a support line during an uptrend and a resistance during a downtrend.
LS B (light pink) usually acts as a support line during a downtrend and a resistance during an uptrend.
Look into the broader trend to verify the strength of the Ichimoku cloud signal. If the signal is part of a larger trend, it would be likely it is a stronger signal than a “pop-up” trend.
The Ichimoku cloud works best when accompanied by a trend (bullish/bearish) in crypto. Look closely at the position, colour of the cloud and volume.
Limitations of the Ichimoku Cloud
This tool greatly depends on historical data and just like any other technical analysis tool, it will not give you a 100% track record.
Although it may predict the future, there are bigger forces in the macro environment which play a bigger effect on the market prices.
Taking a look at the bigger picture, with larger time frames, may also be wise. When used in smaller time frames, the Ichimoku cloud may not account for larger trends.
Combining Ichimoku Cloud with other tools
The Ichimoku tool is rarely used alone. Traders may want to employ other tools and methods to better predict support and resistance levels. Also, read Technical Analysis Basics – How to Identify Support and Resistance.
Some popular indicators to pair with the Ichimoku Cloud are:
- Volume Indicator
- Stochastic RSI; Technical Analysis Basics – Moving Averages and Relative Strength Index (RSI)
- Bollinger Bands; Technical Analysis Basics: Bollinger Bands
- Fibonacci Retracement; Technical Analysis Basics: Fibonacci Retracements
[Editor’s Note: This article does not represent financial advice. Please do your own research before investing.]
Featured Image Credit: Chain Debrief